Cardano Price Analysis: ADA/USD May Find Comfort in the Bearish Zone
Cardano Price Analysis – October 17 The Cardano price is down by 2.48% over the last 24 hours. The next support of the coin may likely come at $2.0 level. ADA/USD Market Key Levels: Resistance levels: $2.5, $2.6, $2.7...
Cardano Price Analysis – October 17
The Cardano price is down by 2.48% over the last 24 hours. The next support of the coin may likely come at $2.0 level.
ADA/USD Market
Key Levels:
Resistance levels: $2.5, $2.6, $2.7
Support levels: $1.85, $1.75, $1.65
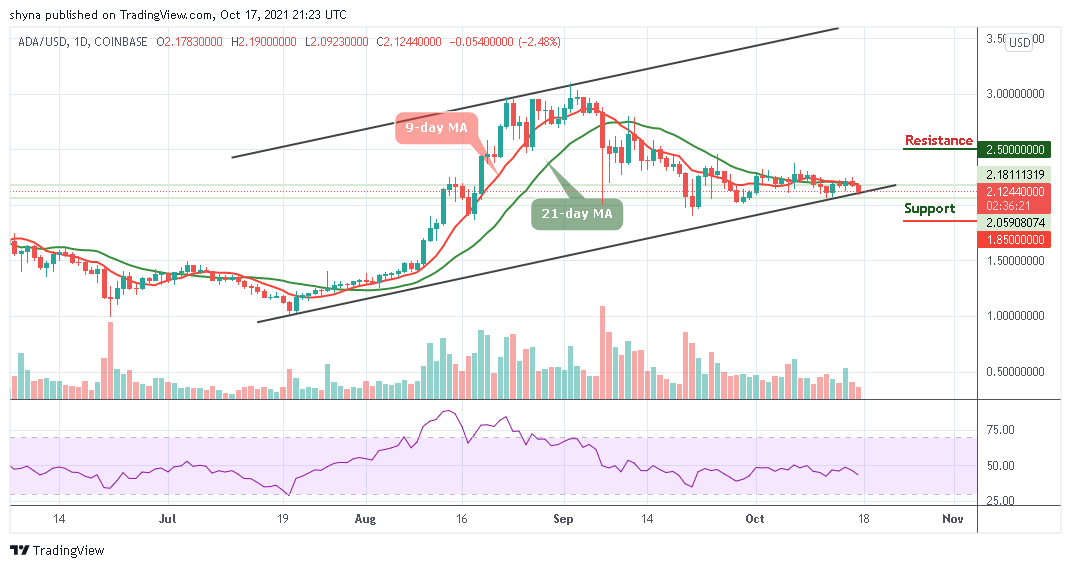
ADAUSD – Daily ChartADA/USD is falling beneath the long-term support at $2.20, which is now subjected to the price actions below the 9-day and 21-day moving averages over the past few days of trading. As the bears take charge, the coin may lose momentum to the lower side of the channel along with a potential price surge. Meanwhile, the technical indicator Relative Strength Index (14) on the daily chart is bearish and continues to issue sell signals.
Cardano Price Analysis: Cardano (ADA) May Fall More
According to the daily chart, if ADA/USD decides to stay under the control of bears, the price may likely drop to the nearest supports at $1.85, $1.75, and $1.605. On the upside, the bulls need to push the market price above the 9-day and 21-day moving averages to reach the potential resistance levels of $2.50, $2.60, and $2.70.
ADA/BTC Market: ADA Price Remains At the Negative Side
When compares with Bitcoin, the Cardano market is seen to be moving within the oversold region and within the descending channel where the price is expected to break below the lower boundary of the channel. Therefore, should the price cross below the channel, the market could experience more downtrends that may touch the nearest support level of 3000 SAT and below.
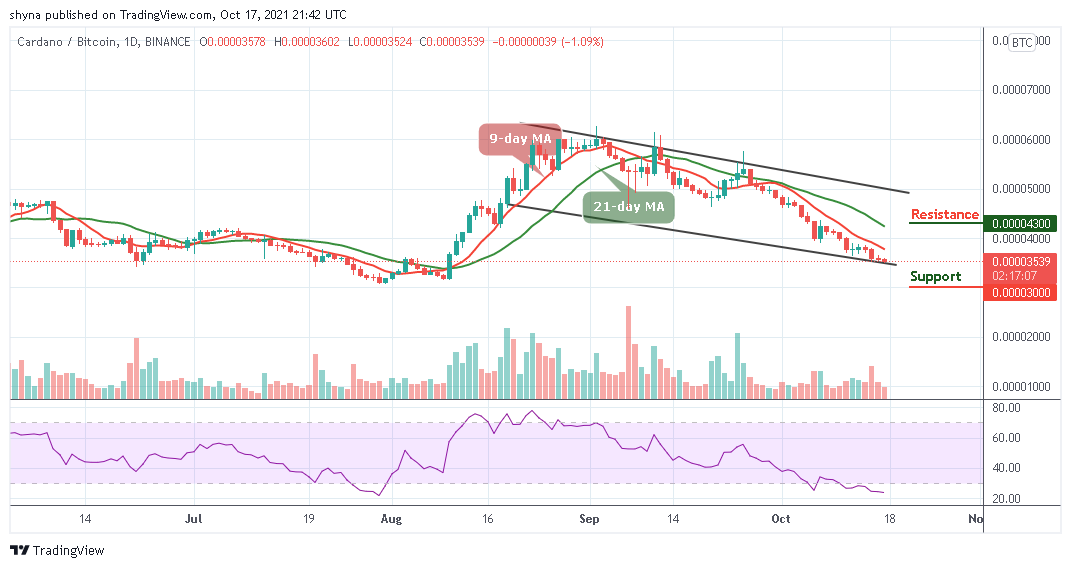 ADABTC – Daily Chart
On the contrary, if the bulls could manage and push the market towards the north, it may cross above the 9-day and 21-day moving averages. If successful, the ADA price may reach the resistance level of 4300 SAT and above. More so, the technical indicator Relative Strength Index (14) confirms that the market is been controlled by the sellers as the signal line remains within the oversold region.
SNEKbot by DexHunter on CARDANO
Cardano's Telegram Trading Bot live on Cardano mainnet!TRADE NOW!