Cardano Price Analysis: ADA/USD Bulls May Touch $1.20 Resistance
Cardano Price Analysis – April 3 Cardano may lack short-term and medium-term support, but if the price rises further, the coin is likely to face moderate volatility in the market soon. ADA/USD Market Key Levels: Resistance levels: $1.40, $1.50,...
Cardano Price Analysis – April 3
Cardano may lack short-term and medium-term support, but if the price rises further, the coin is likely to face moderate volatility in the market soon.
ADA/USD Market
Key Levels:
Resistance levels: $1.40, $1.50, $1.60
Support levels: $0.95, $0.85, $0.75
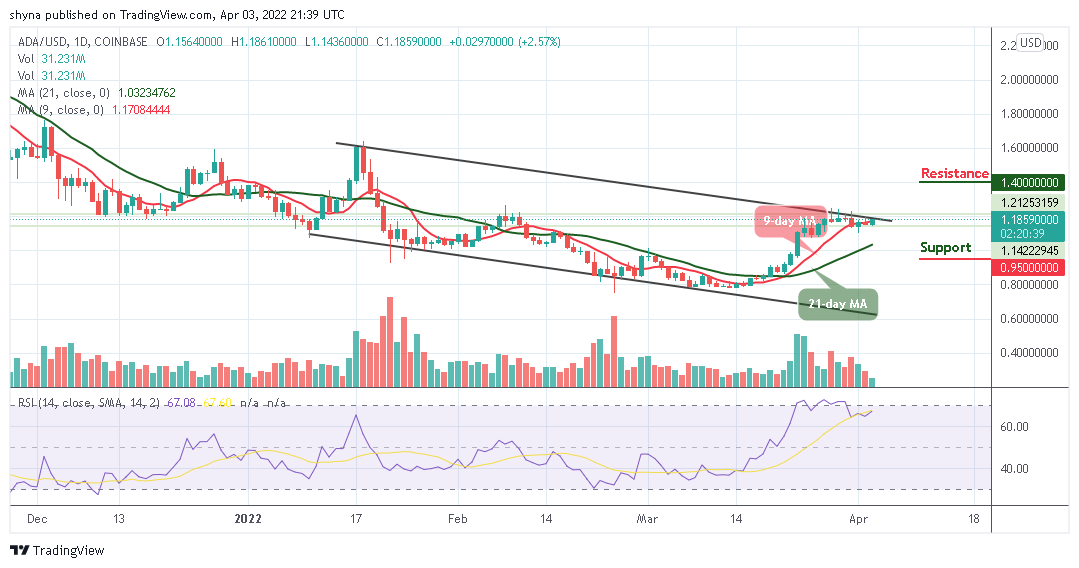
ADA/USD is currently trading around the $1.185 level above the 9-day and 21-day moving averages. In the range of the descending channel, the closest support is located at $1.10, with a close resistance at $1.25. Meanwhile, if the market increases, additional resistance can be found above the upper boundary of the channel.
Cardano Price Analysis: Cardano (ADA) May Go Bullish
As revealed by the daily chart, it is obvious that the Cardano market may likely create more bullish trends once the sideways movement fades away, and this is noticeable for the technical indicator Relative Strength Index (14) as the signal line moves to cross into the overbought region.
At the time of writing this analysis, the market keeps rebounding from the daily low of $1.143 below the 9-day moving average; therefore, any bearish movement below the daily low may lead the coin to a serious downtrend around the 21-day moving average. However, the support levels for the coin may be located at $0.95, $0.85, and $0.75, while the resistance levels lie at $1.00, $1.05, and $1.10 respectively.
ADA/BTC Market: Price May Keep Moving Sideways
When compared with Bitcoin, the support level of this range is built around 2500 SAT. The resistance is set at 2600 SAT because the market price is still changing around the 9-day moving average. Technically, the price continues to move sideways within the channel since a few days ago as the technical indicator Relative Strength Index (14) moves above the 60-level.
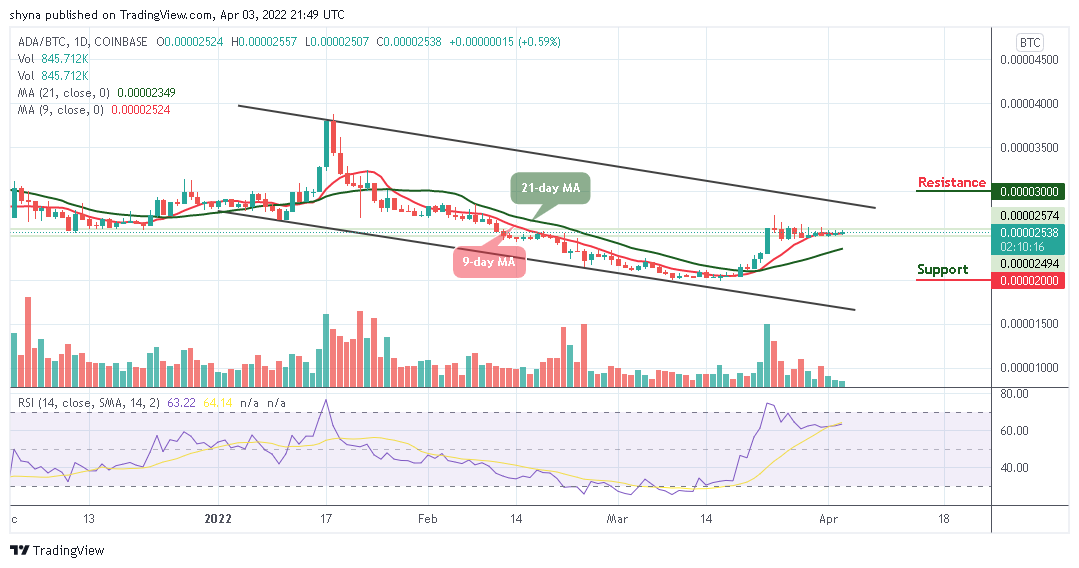
However, if the Cardano price crosses below the 21-day MA, ADA/BTC may likely hit the support level AT 2000 SAT and below. Moreover, any bullish movement above the upper boundary of the channel may allow the market to form a new upward trend and could reach the potential resistance at 3000 SAT and above.
SNEKbot by DexHunter on CARDANO
Cardano's Telegram Trading Bot live on Cardano mainnet!TRADE NOW!