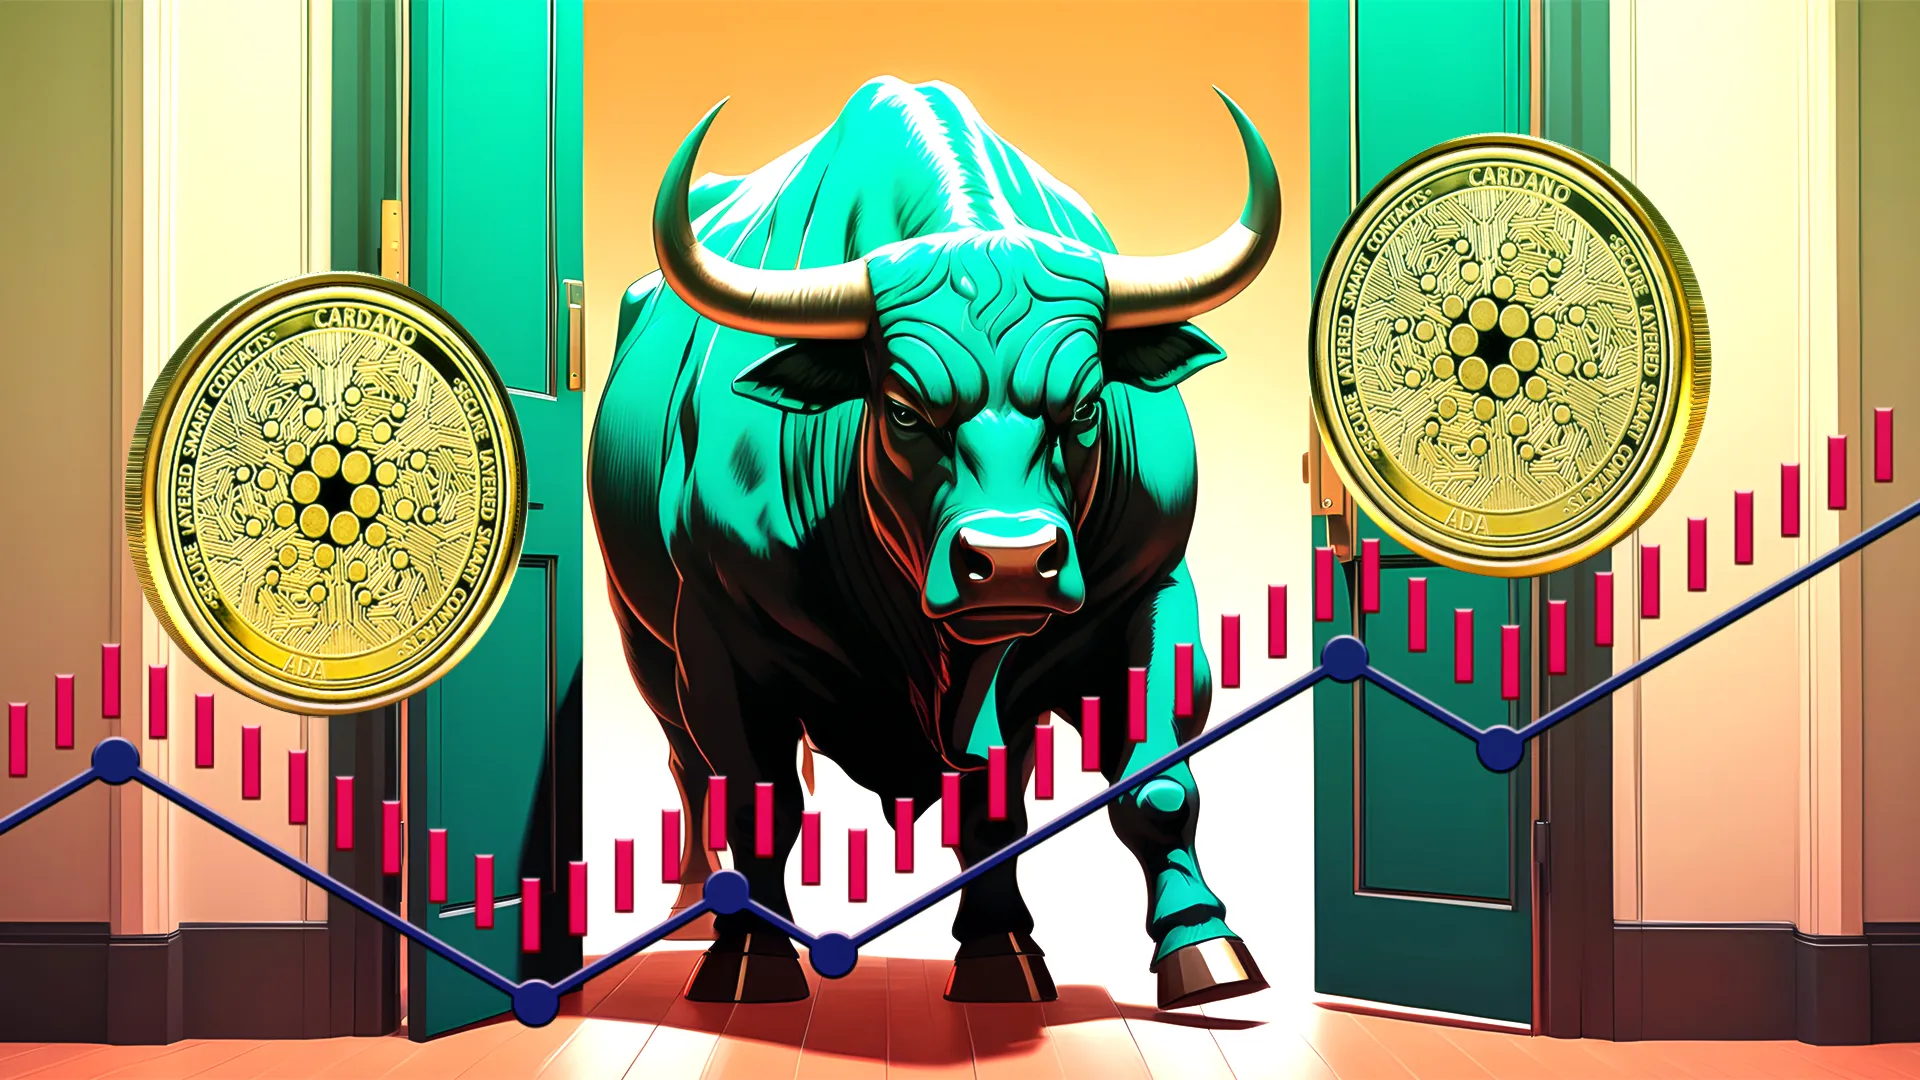
Cardano price prediction: ADA price stuck in triangle pattern due to buyers and sellers colliding
Near the physiological round support of $1, Cardano coin’s investors are attempting to break out the symmetrical triangle pattern. After forming the inside candle over the weekly price chart, ADA price seems to be in the bullish territory by...

- Near the physiological round support of $1, Cardano coin’s investors are attempting to break out the symmetrical triangle pattern.
- After forming the inside candle over the weekly price chart, ADA price seems to be in the bullish territory by 3.51% today.
- Cardano with Bitcoin pair price is trading slightly negative by 0.14% at 0.00002748 Satoshis.
Cardano coin has been trading into the symmetrical triangle pattern over the past 10 days after resting the physiological round number of $1.0; the critical support is valid from last year. On the flip side, $1.60 has a pivotal resistance for the short term. At $1.60, the coin retested twice, which makes this level shabby and may breach ahead. The ADA price is trading at $1.6, which is bullish by 3.52% at the time of writing. This week, ADA regained around 3% of the cost after rebounding from $1.
ADA coin has gained 13% in trading volume over the last 24 hours, favouring the bulls. On the other hand, the volume oscillator broke down the Neutra level on January 26 and continued the lower momentum. ADA fell 44.02 %(from January 18) to reach a nine-month low on January 22.
The ADA coin respects the psychological round level of $1.0
Cardano price with the Bitcoin pair is moving lower since the highest peak of the pair (0.00006271 satoshis) by indicating sell-on-rise formation. The ADA/BTC pair recently failed again to breach the declining trendline to the upside. However, the ADA/BTC pair price seems to be in neutral territory at 0.00002747 satoshis. Pair price appears on a clear path towards reaching the support level at 0.00002558after resisting the downtrend trendline. A couple of the trading sessions before, the pair slipped below the 50-day moving average, which could change into the bullish hurdle ahead.
IN EARLY SEPTEMBER, the RSI saw a sharp decline to dip from an overbought zone into an oversold zone. At the time of writing, the RSI is moving below the halfway mark of the indicator. However, the moving average conversion divergence is in negative territory, generating a bearish crossover in September. In the context of the daily price chart, ADA price is testing just above a lower level of the Bollinger Bands indicator, which could attract buyers to invest.
RelatedPosts


Conclusion
After the sharp selling, the Cardano coin is just above the key $1.0 support, and buyers are attempting to hold the price above $1. If the investors fail to step in soon, then it is unlikely for the downtrend to stop. ADA could bounce back rapidly if price breakout this symmetrical triangle pattern this week.
Support level – $1.0
Resistance level – $1.6 and $2.0
Disclaimer
The views and opinions stated by the author, or any people named in this article, are for informational ideas only, and they do not establish the financial, investment, or other advice. Investing in or trading crypto assets comes with a risk of financial loss.
SNEKbot by DexHunter on CARDANO
Cardano's Telegram Trading Bot live on Cardano mainnet!TRADE NOW!