Cardano Price Analysis: ADA/USD Revisits the Previous Support at $1.31
Cardano Price Analysis – January 3 According to the daily chart, the ADA market is down as the coin slides below the moving averages to touch the low of $1.30. ADA/USD Market Key Levels: Resistance levels: $1.60, $1.70, $1.80...

Cardano Price Analysis – January 3
According to the daily chart, the ADA market is down as the coin slides below the moving averages to touch the low of $1.30.
ADA/USD Market
Key Levels:
Resistance levels: $1.60, $1.70, $1.80
Support levels: $1.10, $1.00, $0.90
 ADAUSD – Daily Chart
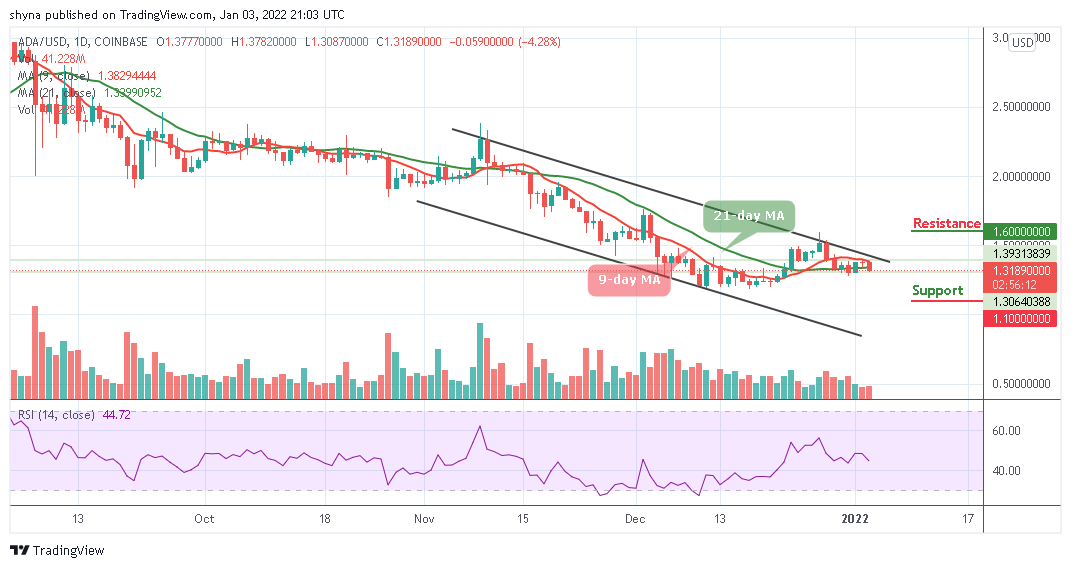
ADA/USD is currently trading at $1.31 as the bears delay the coin from crossing above the upper boundary of the channel. Yesterday, the Cardano price encountered higher resistance at $1.39 and later dropped below the opening price. Today, Cardano price is down by 4.28% of its value and the downside momentum may be gaining traction.
Cardano Price Analysis: ADA Price May Push Lower
At the time of writing, ADA/USD is changing hands at $1.31 as the coin keeps trading below the 9-day and 21-day moving averages with a 4.28% loss since the start of the day, though it is still following a sideways movement on a day-to-day basis but the Relative Strength Index (14) is facing the south. On the intraday chart, ADA/USD may move below to touch the next support at $1.20.
However, a sustainable move below this area could worsen the short-term technical picture and allow for an extended decline towards $1.10, $1.00, and $0.90 supports. On the upside, a return above the 9-day and 21-day moving averages may help to mitigate the immediate bearish pressure. The price could return inside the previous consolidation range and get a chance to cross above the channel to hit the resistance levels of $1.60, $1.70, and $1.80 respectively.
ADA/BTC Market: The Price Are Likely to Drop More
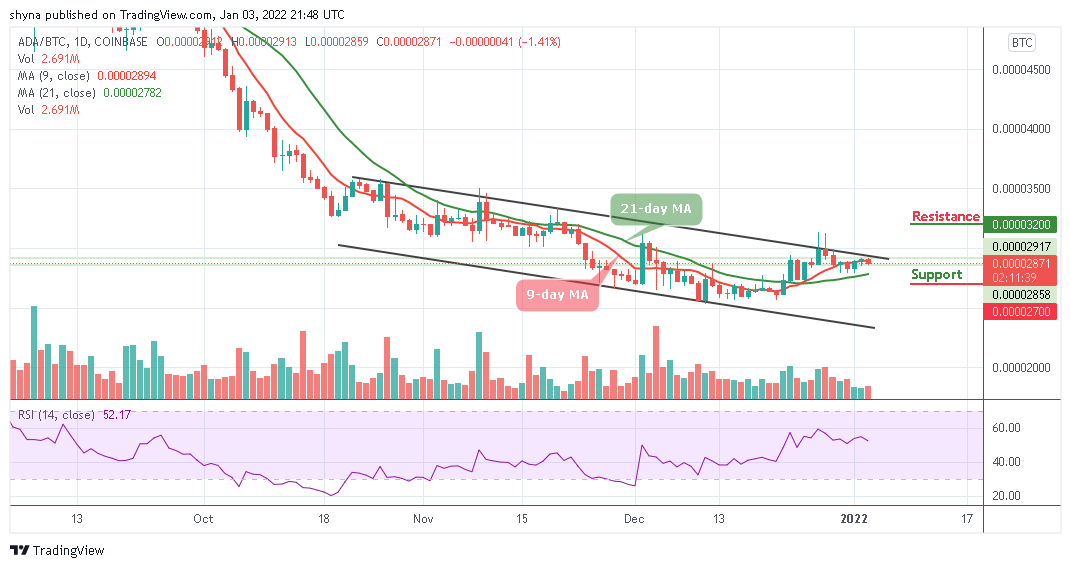
Against BTC, the direction of the market is trading sideways. Although the price is still unstable; trading at a price level of 2871 SAT. A low swing could reach the 2700 SAT support level and below, creating a new low for this month. For now, the bears are gaining ground while they are declining; now slowly in action as the Relative Strength Index (14) is likely to move below 50-level.
 ADABTC – Daily Chart
In other words, a rebound is likely to occur if the signal line moves above 60-level and the coin crosses above the 9-day and 21-day moving averages to reach the potential resistance at 3200 SAT and above.
Delegate Your Voting Power to FEED DRep in Cardano Governance.
DRep ID: drep12ukt4ctzmtf6l5rj76cddgf3dvuy0lfz7uky08jfvgr9ugaapz4 | We are driven to register as a DRep by our deep dedication to the Cardano ecosystem and our aspiration to take an active role in its development, ensuring that its progress stays true to the principles of decentralization, security, and community empowerment.DELEGATE VOTING POWER!


