Cardano Price Analysis: ADA/USD Range-bounds Following $2.5 Rejection
Cardano Price Analysis – September 15 The Cardano price failed to recovers from the recent low of $1.95 to trade above $2.8. ADA/USD Market Key Levels: Resistance levels: $2.8, $3.0, $3.2 Support levels: $2.1, $1.9, $1.7 ADA/USD is currently...
Cardano Price Analysis – September 15
The Cardano price failed to recovers from the recent low of $1.95 to trade above $2.8.
ADA/USD Market
Key Levels:
Resistance levels: $2.8, $3.0, $3.2
Support levels: $2.1, $1.9, $1.7
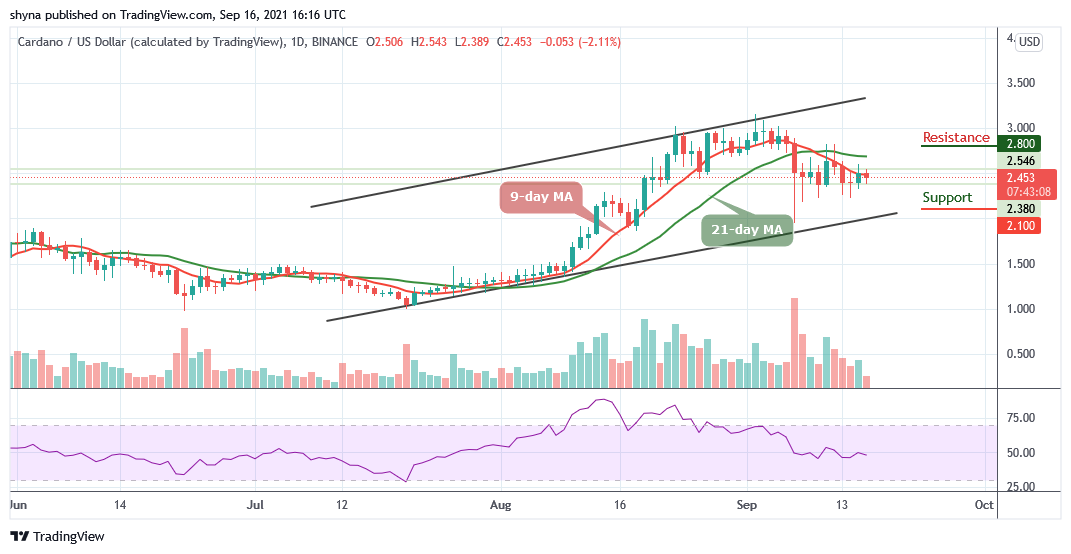
ADAUSD – Daily ChartADA/USD is currently falling below the 9-day moving average after touching the daily high of $2.54, which is now subject to the price actions around the 9-day moving average. However, as the bears step back into the market, the Cardano price is seen losing momentum to the lower side of the rising wedge along with a potential price surge.
Cardano Price Analysis: ADA/USD Not Ready for the Upside?
According to the daily chart, the Cardano price is facing the south as the coin remains below the 9-day and 21-day moving averages. Meanwhile, a bullish cross above the 9-day moving average is needed to correct the immediate bearish pressure and bring the coin back on the recovery trend. Once it is out of the way, the upside is likely to gain traction with the next focus on $2.8, $3.0, and $3.2 resistance levels.
However, on the downside, once the support of $2.2 is broken, the sell-off may likely gain traction with the next focus at the nearest support level of $2.1, which could be followed by the nearest support level of $1.9. Therefore, if these levels are broken and the pair remains below the lower boundary of the channel, the downside pressure may increase and the next support is created by the critical support of $1.7 level as the technical indicator Relative Strength Index (14) moves around 50-level.
ADA/BTC Market: Cardano Price May Stay At the Downside
Comparing with BTC, the Cardano (ADA) is following a downward trend as reveals by the technical indicator Relative Strength Index (14). Although the market price is unstable as it hovers at 5100 SAT. Meanwhile, a low swing could push the coin to the support level of 4300 SAT and below. At the moment, the bears are gaining ground while they are declining as the RSI (14) may stay below 50-level.
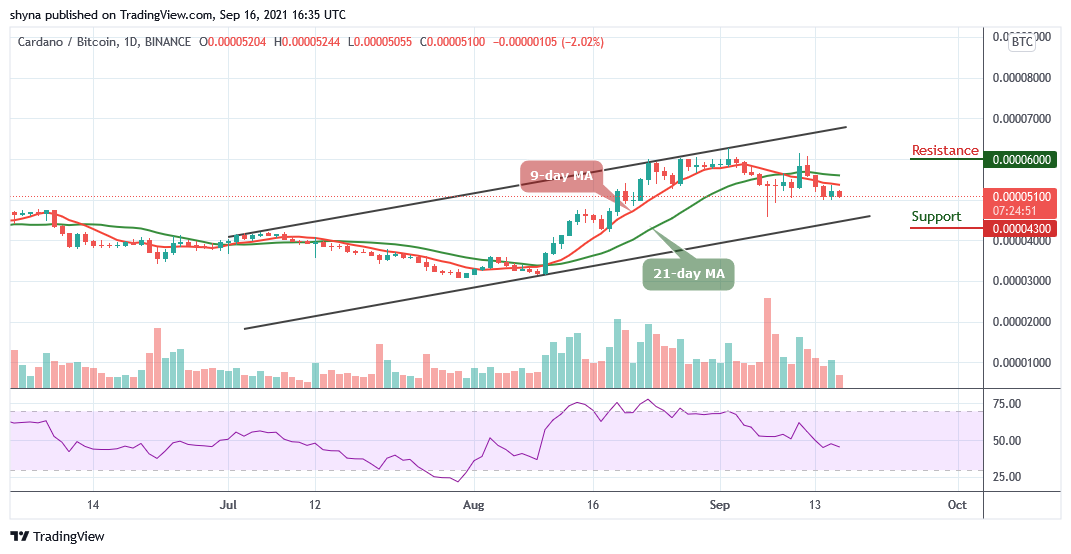 ADABTC – Daily Chart
On the contrary, a rebound may occur if the buyers could defend the current level and push it above the 9-day and 21-day moving averages to hit the potential resistance level of 6000 SAT and above.
Delegate Your Voting Power to FEED DRep in Cardano Governance.
DRep ID: drep12ukt4ctzmtf6l5rj76cddgf3dvuy0lfz7uky08jfvgr9ugaapz4 | We are driven to register as a DRep by our deep dedication to the Cardano ecosystem and our aspiration to take an active role in its development, ensuring that its progress stays true to the principles of decentralization, security, and community empowerment.DELEGATE VOTING POWER!