Cardano Price Analysis: ADA/USD Faces the South; Trades below $1.02
Cardano Price Analysis – January 28 The Cardano price slips one more time as the price drops and touches the daily low of $1.00. ADA/USD Market Key Levels: Resistance levels: $1.30, $1.40, $1.50 Support levels: $0.80, $0.70, $0.60 ADA/USD...
Cardano Price Analysis – January 28
The Cardano price slips one more time as the price drops and touches the daily low of $1.00.
ADA/USD Market
Key Levels:
Resistance levels: $1.30, $1.40, $1.50
Support levels: $0.80, $0.70, $0.60
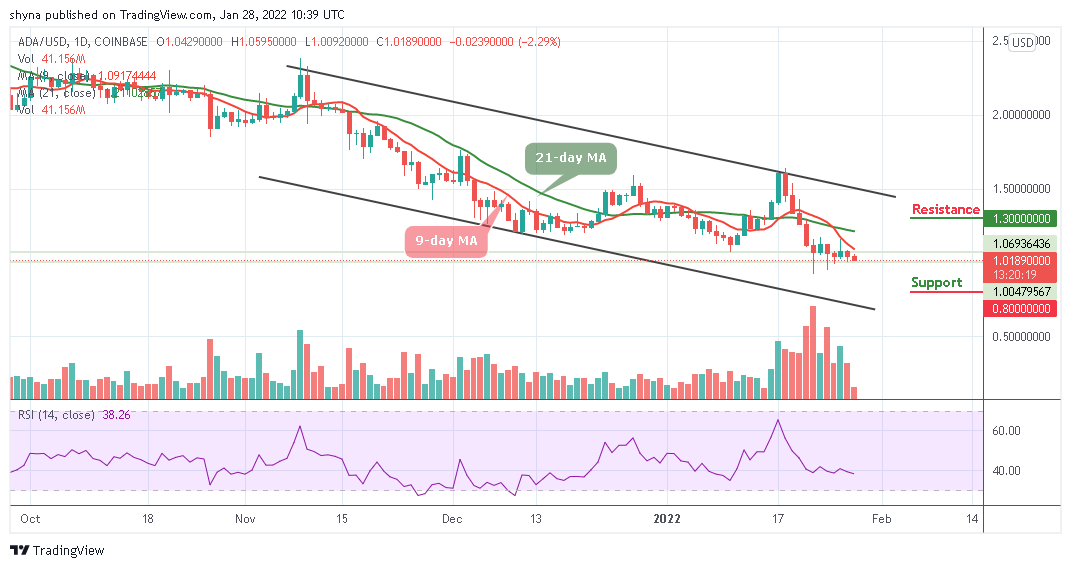
ADAUSD – Daily ChartADA/USD is likely to fall below the long-term support at $0.85, which is now, subject to the price actions below the 9-day and 21-day moving averages. As the bears take charge, the coin is now losing momentum to the lower side of the ascending channel along with a potential price surge. Any upward movement may likely push the coin above the moving averages in the next positive move.
Cardano Price Analysis: Cardano (ADA) Ready for More Downtrends
However, if ADA/USD decides to stay under the control of bears, the price may likely drop to the nearest supports at $0.80, $0.70, and $0.60. On the upside, the bulls may need to push the price above the moving averages to reach the resistance at $1.30, $1.40, and $1.50 levels. Meanwhile, the technical indicator Relative Strength index (14) is crossing below 40-level, any further bearish movement towards the oversold region may likely introduce more bearish signals into the market.
ADA/BTC Market: Price May Still Hover at the Downside
Against Bitcoin, the market is seen to be moving below the 9-day and 21-day moving averages within the channel where the price is expected to move near the lower boundary of the channel. Should the price cross below the channel, the market may experience a downward trend that could hit the nearest support level of 2500 SAT and below.
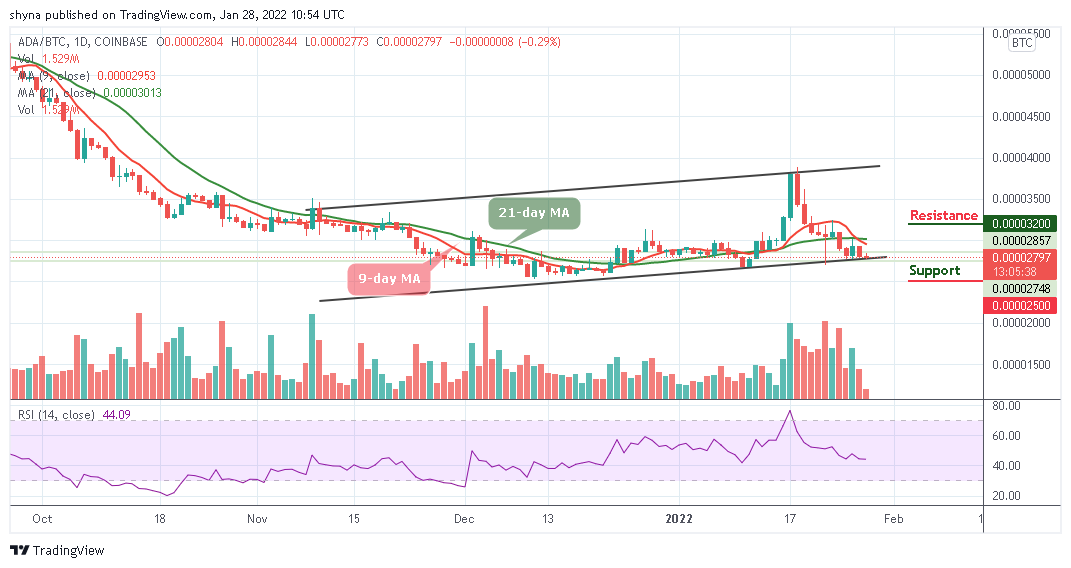 ADABTC – Daily Chart
However, if the bulls gathered and push the market to the north, it could cross above the moving averages, ADA price may reach the resistance level of 3200 SAT and above respectively. The technical indicator Relative Strength index (14) confirms that the market may continue to be controlled by the bears if the signal line crosses below 40-level.
SNEKbot by DexHunter on CARDANO
Cardano's Telegram Trading Bot live on Cardano mainnet!TRADE NOW!