Cardano Price Analysis: ADA/USD Appears Bullish with a Major Support at $1.20
Cardano Price Analysis – June 27 The Cardano price draws a probable uptrend as it trades at $1.34 and appears bullish as it is continuously spiked from the trading price of $1.25. ADA/USD Market Key Levels: Resistance levels: $1.60,...

Cardano Price Analysis – June 27
The Cardano price draws a probable uptrend as it trades at $1.34 and appears bullish as it is continuously spiked from the trading price of $1.25.
ADA/USD Market
Key Levels:
Resistance levels: $1.60, $1.70, $1.80
Support levels: $1.0, $0.90, $0.80
 ADAUSD – Daily Chart
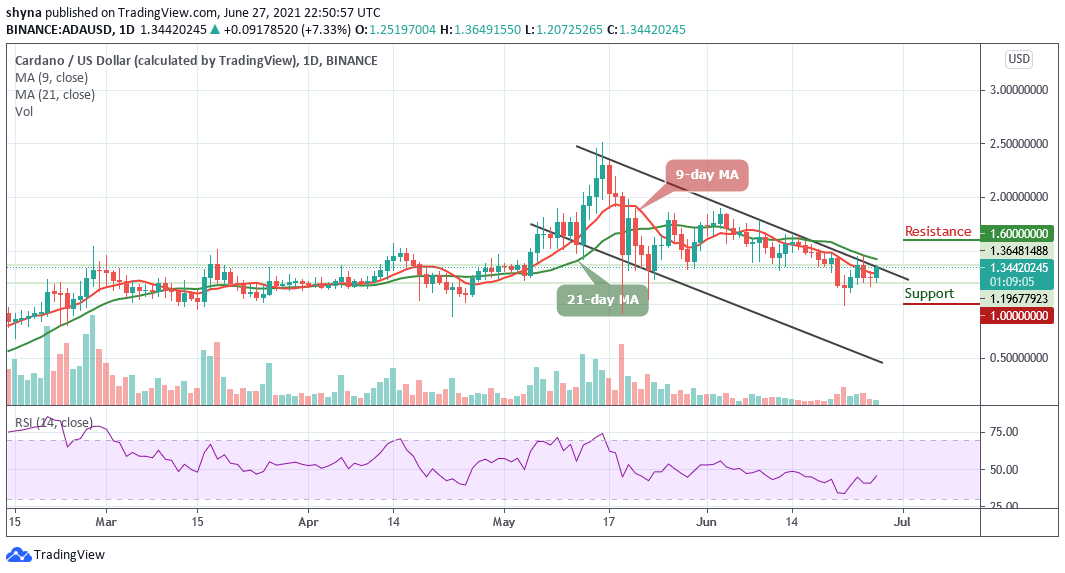
ADA/USD is facing a bit of price pullback as the market opens today. The technical indicator Relative Strength index (14) is moving towards the bullish phase already as the signal line moves above 45-level. Therefore, if the price path slips below the 9-day moving average, a bearish price move may be anticipated. ADA started a strong rebound journey a few days ago and at the time of writing; it has reached as high as $1.36 from $1.20.
Cardano Price Analysis: What to Expect from Cardano (ADA)
The Cardano price is currently hovering below the 21-day moving average. However, if ADA/USD decides to stay under the control of bears, the price may likely drop to the nearest supports at $1.00, $0.90, and $0.80. Looking at the upside, the bulls need to push the coin above the 21-day moving average to reach the potential resistance levels at $1.60, $1.70, and $1.80.
ADA/BTC Market: Price Consolidates around the Moving Averages
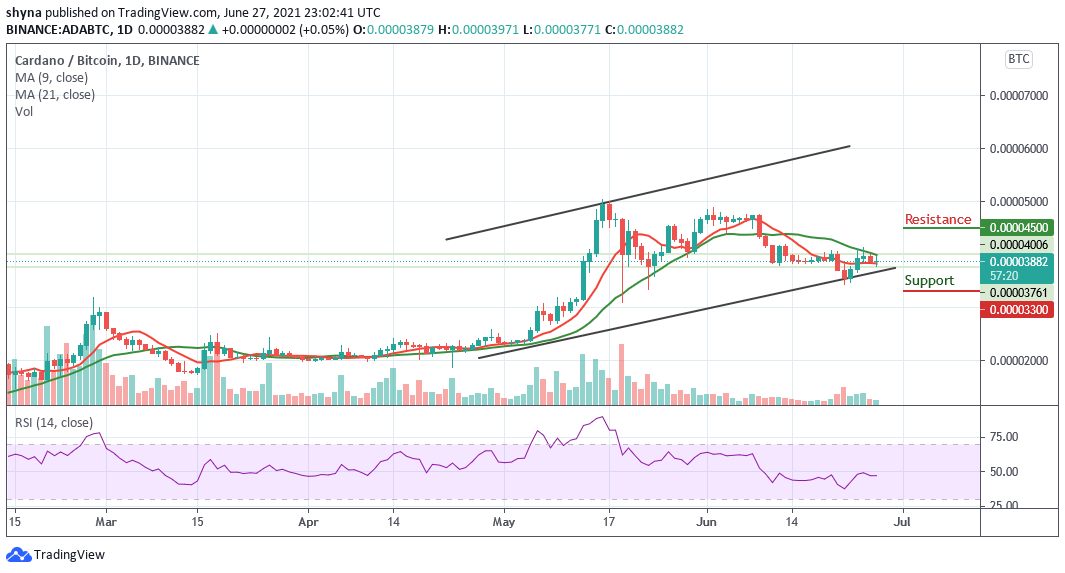
When compares with Bitcoin, the Cardano price is seen hovering within the 9-day and 21-day moving averages where the price is expected to break above the 21-day moving average. However, should the price cross above this barrier, the market could experience upward trends that may touch the nearest resistance level of 4500 SAT and above.
 ADABTC – Daily Chart
However, if the bears could push the market below the 9-day moving average to cross below the lower boundary of the channel, Therefore, ADA price may reach the support levels of 3300 SAT and 3000 SAT respectively. More so, the technical indicator Relative Strength index (14) confirms that the market may continue to follow the downtrend if the signal line stays below 50-level.
Delegate Your Voting Power to FEED DRep in Cardano Governance.
DRep ID: drep12ukt4ctzmtf6l5rj76cddgf3dvuy0lfz7uky08jfvgr9ugaapz4 | We are driven to register as a DRep by our deep dedication to the Cardano ecosystem and our aspiration to take an active role in its development, ensuring that its progress stays true to the principles of decentralization, security, and community empowerment.DELEGATE VOTING POWER!


