Cardano price analysis: ADA breaks above $2.14 as bulls gain 5.7 percent overnight
The post Cardano price analysis: ADA breaks above $2.14 as bulls gain 5.7 percent overnight appeared on BitcoinEthereumNews.com. TL;DR Breakdown Cardano price analysis is bullish today. The resistance for ADA is found at $2.19. Support is present at $2.06....

TL;DR Breakdown
- Cardano price analysis is bullish today.
- The resistance for ADA is found at $2.19.
- Support is present at $2.06.
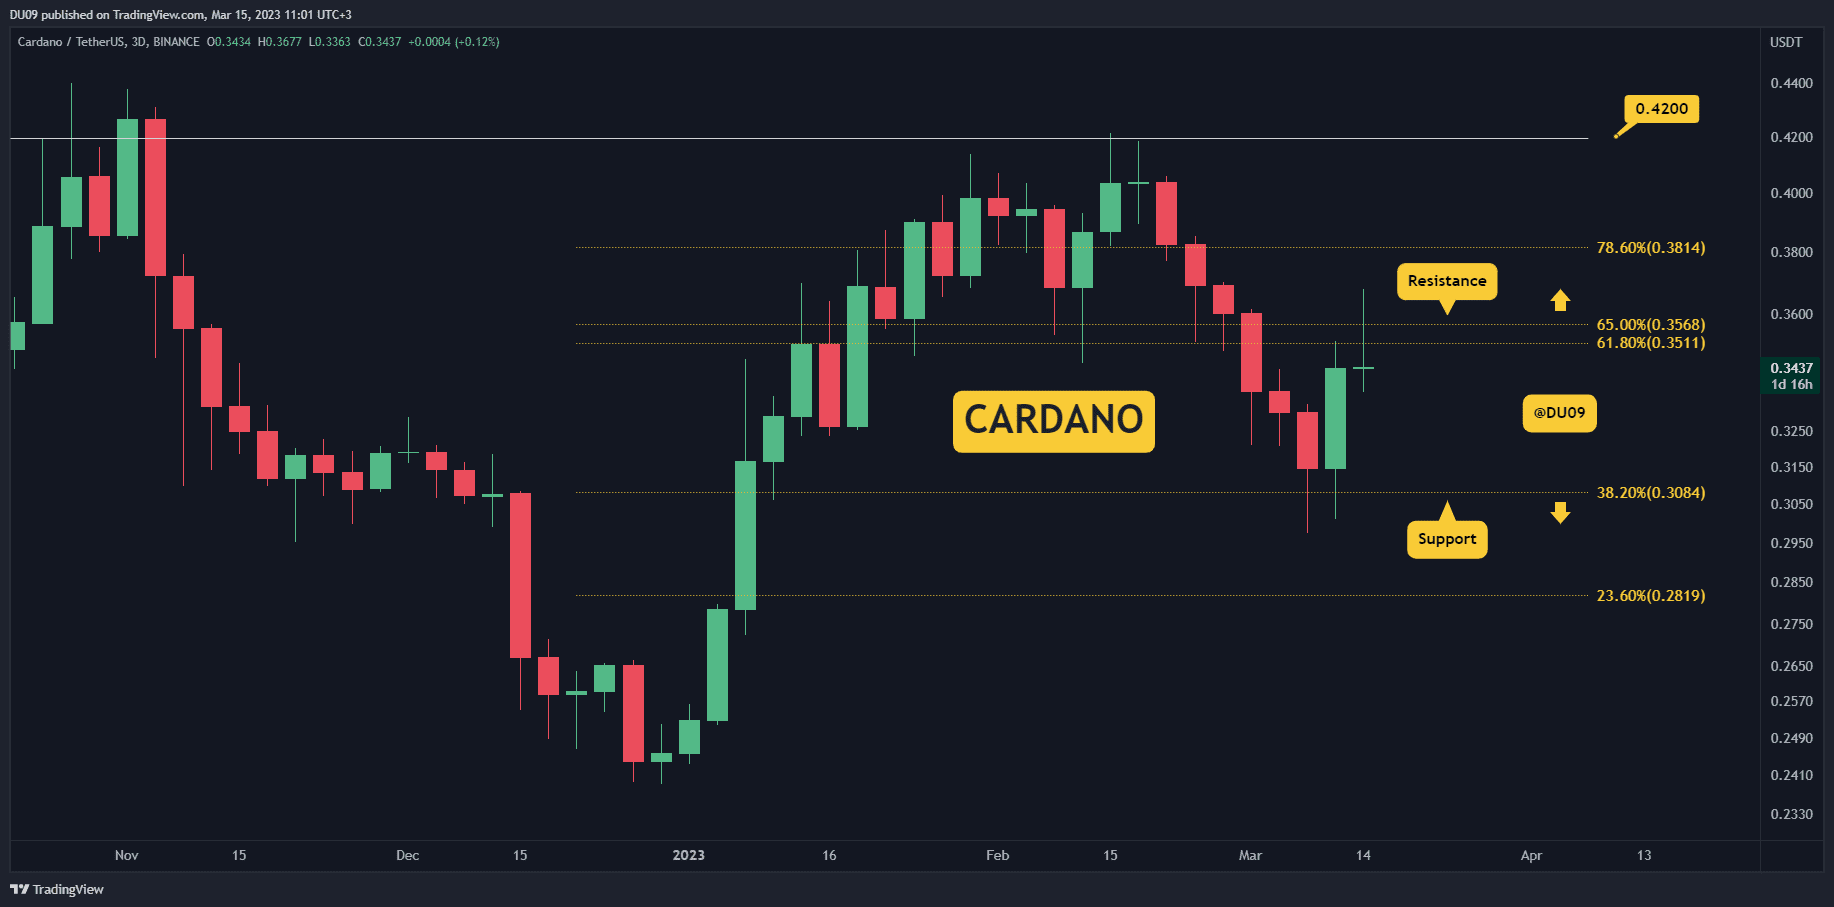
Cardano price analysis indicates that the bullish momentum has brought the price to the $2.15 level and more improvement in the coin’s value is to be expected in the coming hours. Cardano’s price trend line has been upwards for the past few days as the coin has shown good performance over the past week, gaining significant value. The Cardano has moved past the $2.14 crucial resistance level today, which was the point from where it fell on 27th October, now the next resistance for ADA/USD is present at $2.19, and if the bullish momentum continues, then Cardano may break above this level as well.
ADA/USD 1-day price chart: Cardano recovering well as bulls mark 5.7 percent gain
The 1-day Cardano price analysis shows that an increase in the price value has been observed today as the ADA/USD pair is trading for $2.15 in the market at the time of writing. The ADA/USD has gained a value of 5.7 percent over the last 24 hours and shows around 10 percent gain over the course of the last seven days. The trading volume has also increased by 67 percent.
 ADA/USD 1-day price chart. Source: TradingView
The volatility for Cardano is mild as the Bollinger bands are comparatively narrow, but as the last five candlesticks on the chart are green, indicating a continuous increase in price, so the bands will expand in the near future, which will indicate more volatility for ADA price, moreover, as the price is trading above the mean average line of the indicator present at the $2.04 representing support for the coin, it is expected that the bands will observe an upwards breakout in the coming days.
The Cardano is in high demand in the market as more and more buyers are entering the market, due to which the price propulsion is also positive. The relative strength index (RSI) also proves the point, as the RSI is on an upwards curve at index 55, indicating the buying activity going on in the market.
Cardano price analysis: Recent developments and further technical indications
The 4-hour Cardano price analysis shows that the price has been increasing for the last 16 hours, and yet no bearish activity has been observed as the bullish momentum seems to be healthy, but looking at the previous chart patterns, there exist chances for a retracement in the coming hours as well.
 ADA/USD 4-hours price chart. Source: TradingView
The volatility on the 4-hour chart is quite high as the volatility indicator has been expanding since yesterday. Now the upper Bollinger band is at $2.14, and the lower band is at the $1.92 mark. The moving average is trading at the $2.07 mark, and the RSI has entered the oversold region on the 4-hour chart and is found at index 73.
Cardano price analysis conclusion
The Cardano price analysis shows that the coin has successfully bypassed the $2.14 crucial resistance, and now the bulls are aiming for another crucial resistance of $2.19. We expect ADA/USD to correct for a few hours before attempting $2.19, but if the bulls maintain their momentum, then Cardano may break above this resistance in the next few hours.
Disclaimer. The information provided is not trading advice. Cryptopolitan.com holds no liability for any investments made based on the information provided on this page. We strongly recommend independent research and/or consultation with a qualified professional before making any investment decisions.Source: https://www.cryptopolitan.com/cardano-price-analysis-2021-11-09/

Post navigation
SNEKbot by DexHunter on CARDANO
Cardano's Telegram Trading Bot live on Cardano mainnet!TRADE NOW!