Is Cardano Bottoming Out? Bullish Pattern Signals Possible Reversal - Crypto Economy
TL;DR Cardano trades at $0.3493, is down 1.4% on the day, and shows a 41% surge in volume above $630 million, a clear sign of a tug-of-war between buyers and sellers. A fast sell-off pushed ADA below $0.345,...
TL;DR
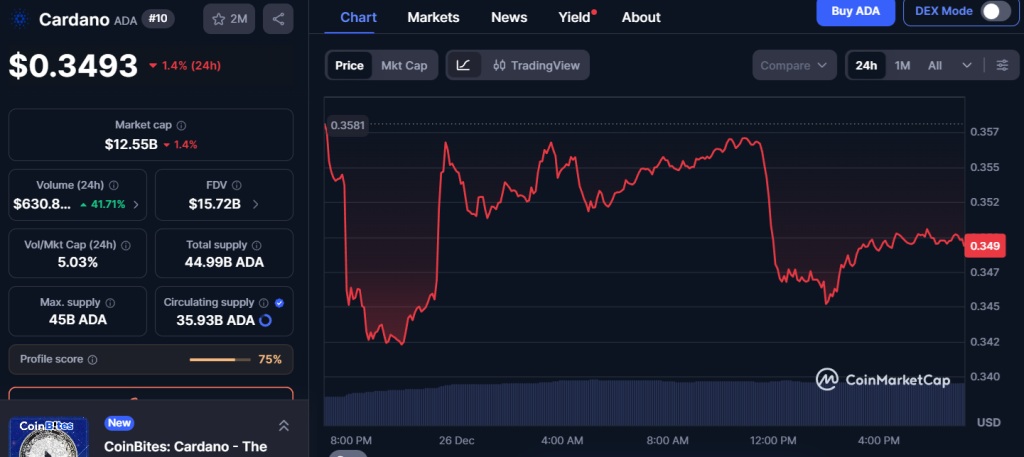
- Cardano trades at $0.3493, is down 1.4% on the day, and shows a 41% surge in volume above $630 million, a clear sign of a tug-of-war between buyers and sellers.
- A fast sell-off pushed ADA below $0.345, triggering stops and an immediate defensive rebound that stabilized the price again.
- On the 12-hour timeframe, a potential bullish engulfing candle is forming; if confirmed, it could mark a turning point.
Cardano once again showed mixed signals after a session marked by strong intraday tension. ADA trades at $0.3493, down 1.4% over the past 24 hours, but the key development is not the price itself but activity: volume jumped 41% and exceeded $630 million. That increase does not reflect a breakout, but rather an open battle between buyers and sellers.
The key shift took place on lower timeframes. A rapid sell-off pushed ADA below $0.345, triggering stops and accelerating the drop. The pressure was brief. Demand stepped in immediately and absorbed the supply, forcing a rebound that brought price back to the current area. This was not a gradual or orderly recovery, but a defensive reaction to an aggressive sell burst. The outcome left price stable, though still below the session highs.
Attention then shifted to the 12-hour chart. There, analyst Ali Martinez pointed out the possible formation of a bullish engulfing candle. This pattern occurs when a bullish candle fully covers the previous bearish one and often signals seller exhaustion after a downward phase. It does not confirm a trend change on its own, but it does mark a potential inflection point. If the candle closes as expected, Cardano would print its first clear bullish signal on that timeframe since the latest downtrend.
Cardano May Attempt to Stabilize, According to Ali Martinez
Even so, the broader context remains unsupportive. Sentiment is still stuck in extreme fear, with the Fear & Greed Index at 20. Volatility remains elevated, around 7.42%, exposing an unstable and reactive market. Momentum indicators also fail to provide relief: the 14-day RSI hovers near 33, a low level that reflects persistent weakness without reaching oversold territory.
The broader structure remains under pressure. Cardano trades well below its key moving averages. The 50-day SMA stands at $0.445, while the 200-day SMA sits at $0.686. These levels continue to act as bearish reference points and define the ceiling for any rebound attempt.
If price fails to build continuity above nearby resistance levels, the rebound will remain a technical relief move. If demand holds and the pattern highlighted by Martinez is confirmed, Cardano could attempt to move into a stabilization phase
Delegate Your Voting Power to FEED DRep in Cardano Governance.
DRep ID: drep12ukt4ctzmtf6l5rj76cddgf3dvuy0lfz7uky08jfvgr9ugaapz4 | We are driven to register as a DRep by our deep dedication to the Cardano ecosystem and our aspiration to take an active role in its development, ensuring that its progress stays true to the principles of decentralization, security, and community empowerment.DELEGATE VOTING POWER!