Cardano Price Prints TD Buy Signal at $0.57, Is the Bottom In? - The Market Periodical
Key Insights: Cardano price defends $0.52-$0.57 range as buyers accumulate near crucial long-term support. The TD Sequential indicator gives a buy signal suggesting a possible cycle bottom. Long/short ratios...

Key Insights:
- Cardano price defends $0.52-$0.57 range as buyers accumulate near crucial long-term support.
- The TD Sequential indicator gives a buy signal suggesting a possible cycle bottom.
- Long/short ratios improve bullish sentiment and views for a lasting recovery.
Cardano price is stabilizing near $0.54 after a long decline. Analysts look for technical signals that indicate a potential market bottom. The next sessions will possibly confirm whether this setup causes a wider recovery.
Cardano Price Key Support Near $0.52
Market analyst Ali stressed that $0.52 is a key support zone for Cardano. Since November 2024, every test of this area has triggered strong rebounds. The most recent price action again showed signs of accumulation around this historically reactive level.
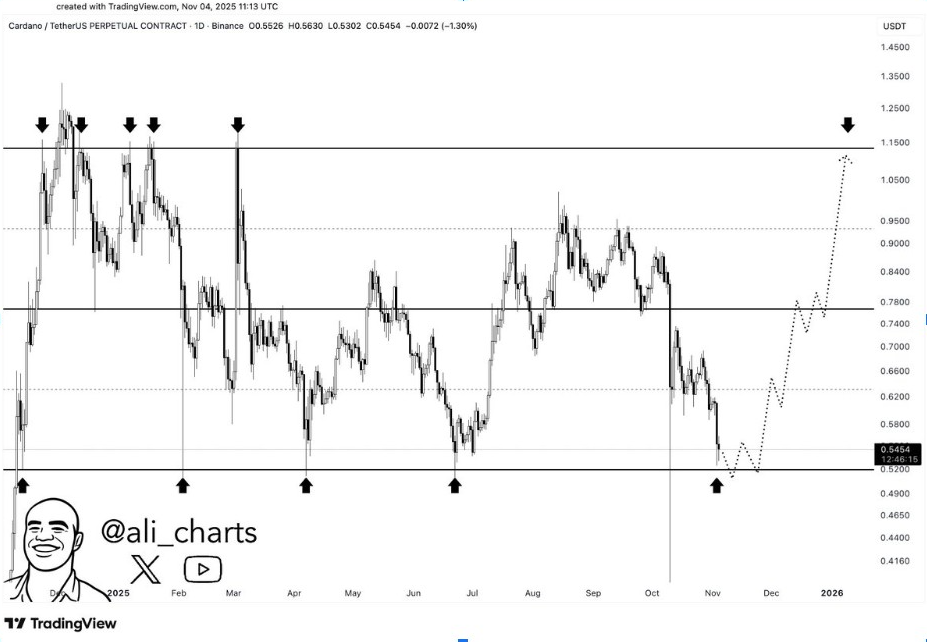
Currently, Cardano price trades around the $0.54 level, with continued support above that key level after several downward rejections. The daily chart identified this area as a key line of defense against selling pressure.
As long as the level is held, bulls may test near $0.78 and $1.15 in the coming few weeks. However, a close below $0.52 would weaken the bullish structure and open the door for lower retracements.
Furthermore, the repeated surges from this level strengthen investor confidence. The structure is similar to previous cycles, where Cardano set up strong bases before powerful recoveries. Sustaining this range may be the key to confirming a sustainable reversal in ADA price.
TD Sequential Indicator Flashes Buy Signal
Ali also noted that the TD Sequential indicator has printed a buy signal on the three-day chart. Historically, this signal occurs around cycle bottoms and is a mark of seller exhaustion and trend reversal. The setup is emerging from an extended downtrend, indicating that bearish momentum is fading.

If confirmed, a break above $0.60 could trigger a wider recovery. The accuracy of the pattern in previous cycles makes this setup crucial for traders seeking early entry. On top of that, the combination of the TD buy signal and the $0.52-$0.57 support forms a strong confluence on the chart.
Volume trends also favor the bullish case, with improving activity in buying. A confirmed breakout above the $0.65 level could signal a breakout and send the top altcoin towards the $0.78 resistance zone.
Price Patterns Suggest Potential for a Breakout
Another view from analyst Nihilus showed a potential breakout formation forming on the daily chart. He found a descending trend line of resistance compressing price action between $0.60 and $0.70. A successful breakout from this zone could send ADA price projecting to $1.20 for the medium term.

The structure resembles an extended base pattern, often seen before mid-term reversals. The price has been consolidating in a horizontal range, indicating a weakening of seller dominance.A breakout sustained above $0.70 could confirm a change in the trend’s direction. Nihilus said this accumulation is possibly laying the foundation for a multi-month rally.
Moreover, his analysis predicted stronger momentum as soon as the compression phase is over. The setup is in line with past market cycles where Cardano bounced strongly off long consolidations. This pattern, along with bullish indicators, supports the gradual improvement of the technical outlook.
Long Traders Reclaim Control as Sentiment Changes
According to Coinglass data, the long/short ratio of ADA has shifted significantly for the better, reflecting the sentiment of traders. Long positions have now increased up to 52.19%, whereas short exposure has declined to 47.81%. This shift implies that investors expect some recovery from current levels.

Such long-dominant ratios near critical supports often result in momentum rallies. When used in conjunction with rising purchasing activity, these signals indicate an increasing level of optimism among leveraged traders. Moreover, this sentiment is met with technical improvements at multiple time frames.
If buying pressure holds above $0.57, ADA price could start a wider upward trend. A higher low would confirm accumulation and bring more buyers. Consequently, the improving ratio and strong technical base combine to add strength to the case for a trend reversal for Cardano price at an earlier stage.

Moses K is a crypto journalist covering markets, regulation, and blockchain trends. He has written for The Coin Republic, Coinchapter, Cryptopolitan, Cryptotale, Coinspeaker, and MPost. Known for his concise, data-driven reporting, Moses focuses on price analysis, on-chain metrics, and policy developments shaping the global digital asset landscape.
Delegate Your Voting Power to FEED DRep in Cardano Governance.
DRep ID: drep12ukt4ctzmtf6l5rj76cddgf3dvuy0lfz7uky08jfvgr9ugaapz4 | We are driven to register as a DRep by our deep dedication to the Cardano ecosystem and our aspiration to take an active role in its development, ensuring that its progress stays true to the principles of decentralization, security, and community empowerment.DELEGATE VOTING POWER!