Cardano’s Weekly Chart Shows Significant Surge After Extended Consolidation – BlockNews.com
😲 Cardano (ADA) reached a high of $1.1945 before retracing to $1.0826, marking a 9.37% decline. Price surged nearly 350% from October lows, signaling strong bullish momentum and renewed investor interest. Key resistance lies near $1.20, with $0.80 as a critical support level for short-term stability. Cardano’s weekly chart reveals a dramatic recovery following a prolonged
- Cardano (ADA) reached a high of $1.1945 before retracing to $1.0826, marking a 9.37% decline.
- Price surged nearly 350% from October lows, signaling strong bullish momentum and renewed investor interest.
- Key resistance lies near $1.20, with $0.80 as a critical support level for short-term stability.
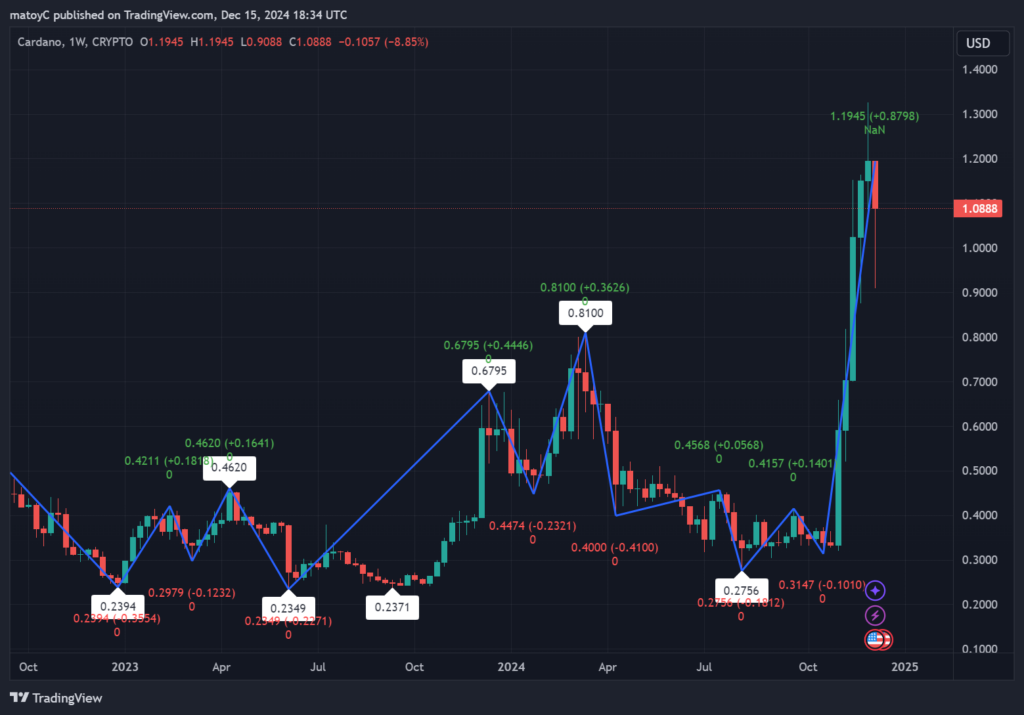
Cardano’s weekly chart reveals a dramatic recovery following a prolonged period of consolidation, as the price climbed sharply to a high of $1.1945 before pulling back to $1.0826. This rally represents one of Cardano’s strongest price performances in over a year, driven by a surge in buying interest and improved market sentiment for the broader cryptocurrency market.
The TradingView chart shows that ADA’s price action formed a series of higher highs and higher lows, starting in October 2023 when it traded at around $0.23. Since then, Cardano has staged an impressive comeback, with buyers pushing the price through multiple resistance levels, including the psychological $0.50 and $1.00 zones.
The recent rally, which culminated at $1.19, reflects an 879% gain from its October 2023 low. This upward move, however, is now showing signs of exhaustion as evidenced by the large red candlestick, indicating profit-taking among investors.
Strong Breakout from Consolidation
The most notable development on the weekly chart is the breakout from the $0.20 to $0.40 consolidation range that lasted for most of 2023. Cardano struggled to gain upward momentum for months but finally broke out in late October. A steady increase in trading volume during the breakout period suggests strong participation from both retail and institutional investors.
As the rally progressed, Cardano faced resistance near $1.20, which coincides with its peak for the current cycle. This level is critical because it marks an area of historical supply, where sellers previously overwhelmed buyers. Should Cardano manage to close decisively above $1.20, the next target for bulls may lie around $1.50.
Indicators Signal Caution Despite Bullish Momentum
Technical indicators point to both strength and caution for ADA. The Relative Strength Index (RSI) has entered overbought territory, suggesting that the asset may face a period of cooling or consolidation before continuing its upward trend.
Volume has significantly increased in recent weeks, aligning with the strong price surge. However, a sharp retracement from the recent highs reflects profit-taking pressure, particularly from short-term traders.
The $0.80 level now serves as a critical support zone. If buyers fail to hold this level, Cardano may retrace further toward $0.60, testing previous resistance levels that could now act as support.
Overall, Cardano’s recent performance on the weekly chart demonstrates robust bullish sentiment, but caution remains as traders monitor for potential reversals. A sustained move above $1.20 could cement further upside for ADA in the weeks ahead.
Delegate Your Voting Power to FEED DRep in Cardano Governance.
DRep ID: drep12ukt4ctzmtf6l5rj76cddgf3dvuy0lfz7uky08jfvgr9ugaapz4 | We are driven to register as a DRep by our deep dedication to the Cardano ecosystem and our aspiration to take an active role in its development, ensuring that its progress stays true to the principles of decentralization, security, and community empowerment.DELEGATE VOTING POWER!

