Cardano Price Suffers Pullback But Analysts See Major Upside Potential Amid Technical Signals
Cardano Price Suffers Pullback But Analysts See Major Upside Potential Amid Technical Signals The recent Cardano (ADA) price movement has sparked intense debate among investors. After reaching a high of...
Cardano Price Suffers Pullback But Analysts See Major Upside Potential Amid Technical Signals
The recent Cardano (ADA) price movement has sparked intense debate among investors. After reaching a high of $0.6897 earlier this week, Cardano experienced a 23% dip, landing it in a technical bear market. Yet, some experts believe that ADA still holds substantial growth potential, predicting that prices could eventually skyrocket. This article dives into the current trends, technical indicators, and expert predictions surrounding Cardano’s price movement as of November 13.
- Cardano Price Suffers Pullback But Analysts See Major Upside Potential Amid Technical Signals
- Cardano Price Reversal: Recent Bearish Moves Explained
- Technical Analysis: Will ADA’s Price Rise to $1 or Beyond?
- Long-Term Price Predictions: Will ADA Achieve $10 or Even $40?
- Key Risks and Bearish Scenarios
- FAQ: Cardano Price Analysis and Predictions
- Why has ADA price dropped recently?
- What is Elliott Wave Theory, and how does it apply to ADA’s price?
- What is a “Golden Cross,” and what does it indicate for Cardano’s future?
- What are the key support and resistance levels to watch for ADA?
- How high could Cardano go, according to analysts?
- What risks could impact Cardano’s price growth?
- Could Cardano’s price reach $1 in the short term?
- What would invalidate the bullish case for ADA?
- Is now a good time to buy ADA?
- Where can I find live updates and analysis on Cardano price?
Cardano Price Reversal: Recent Bearish Moves Explained
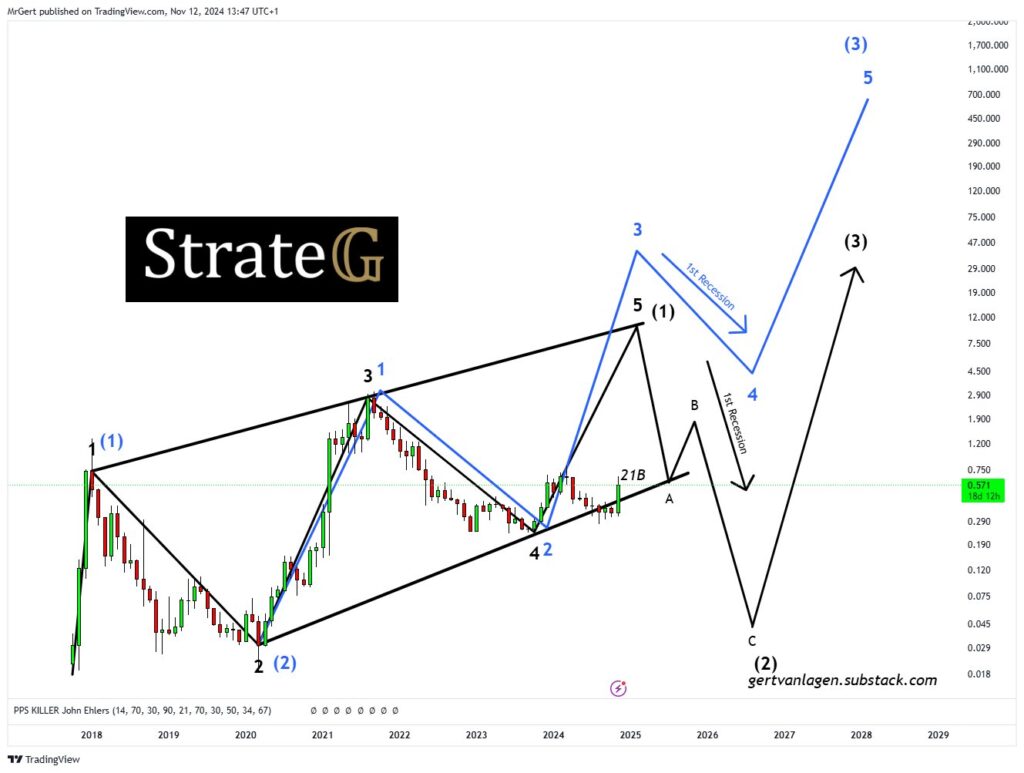
Cardano’s recent price action has disappointed bullish investors, with a two-day drop that wiped out significant gains. Despite the current technical bear market, prominent crypto analysts see the potential for a dramatic upside. Gert van Lagen, a well-known analyst on X (formerly Twitter), has suggested that Cardano could reach $10 under typical bullish conditions, and potentially soar to $40, yielding a 7,400% return from current levels. His analysis hinges on the Elliott Wave theory, suggesting that ADA may be nearing the beginning of a third, extended wave upward.
Technical Analysis: Will ADA’s Price Rise to $1 or Beyond?
In the short term, Cardano’s technical indicators show mixed signals. Analysts have observed the following technical aspects:
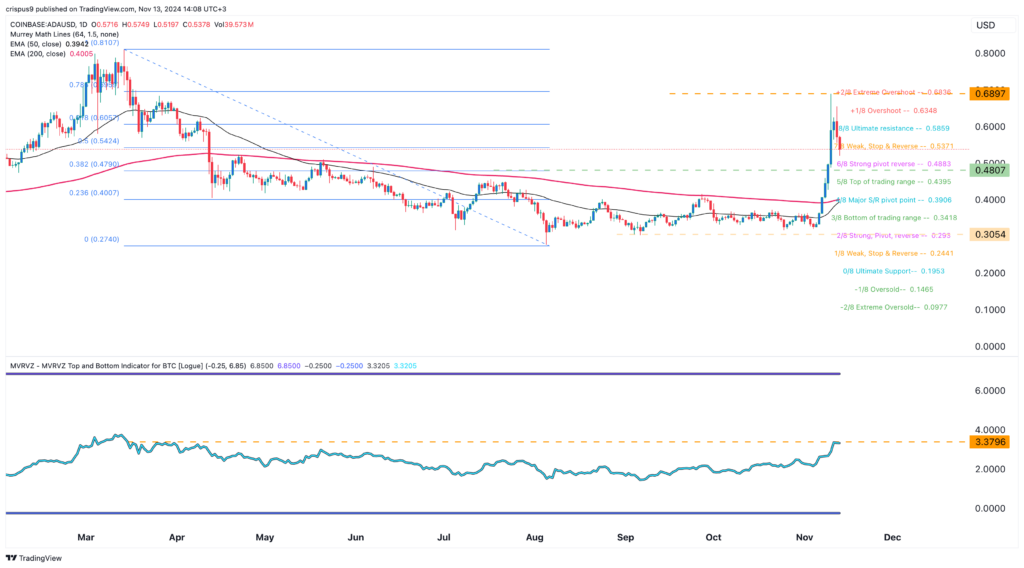
- Golden Cross Formation: The 50-day and 200-day EMAs are approaching a crossover, hinting at a potential bullish turn if Cardano manages to hold above the recent support levels.
- Murrey Math Lines & MVRV Indicator: The Murrey Math Lines suggest that ADA is near a critical support/resistance level, while the MVRV ratio has spiked, indicating potential buying interest or signs of overvaluation.
- Fibonacci Retracement Levels: ADA recently retested the 50% Fibonacci retracement level at $0.5424, suggesting a possible consolidation around this area. Analysts forecast a support retest at the 38.2% retracement level ($0.48), with a recovery rally possible if ADA surpasses $0.6900.
If these indicators align, Cardano could target the $1 level, a psychological and technical resistance zone. A rally to this level represents an 87% jump from current prices, although sustained bearish momentum could see ADA revisiting lower supports, especially if it drops below the pivotal support at $0.40.
Long-Term Price Predictions: Will ADA Achieve $10 or Even $40?
For long-term investors, van Lagen’s optimistic prediction offers an enticing outlook. His $10 target reflects a base-case scenario, hinging on a 1,786% increase from current levels. The more ambitious forecast of $40 aligns with the Elliott Wave theory’s third wave, which tends to produce the most substantial gains in a bullish cycle. While this projection may seem far-fetched to some, the upcoming wave could provide ADA holders with unparalleled growth if historical patterns repeat.
Key Risks and Bearish Scenarios
The bullish thesis for Cardano remains vulnerable to certain risks:
- Falling User Engagement and TVL: Concerns over ADA’s total value locked (TVL) and dwindling user engagement, raised by figures such as Ben Armstrong (BitBoy), could dampen enthusiasm for further price growth.
- Pivotal Support Levels: Failure to maintain key support at $0.40 could shift ADA into a prolonged bearish phase, with possible downside risks extending to $0.3054.
While Cardano’s recent performance may have disappointed some, the technical indicators and long-term analyses suggest there could still be upside potential. Traders and investors are watching closely, especially for signs that ADA will hold its ground around critical support levels or break through resistance to signal a recovery. Whether Cardano will rally toward the $10 or $40 predictions remains uncertain, but the current technical setup leaves room for both caution and optimism.
FAQ: Cardano Price Analysis and Predictions
Why has ADA price dropped recently?
Cardano (ADA) has experienced a 23% drop from its high of $0.6897 due to market corrections and profit-taking by investors. Technical factors, such as the token moving into a bear market, and market sentiment shifts have also contributed to the pullback.
What is Elliott Wave Theory, and how does it apply to ADA’s price?
Elliott Wave Theory is a technical analysis method suggesting that asset prices move in five waves, with the third wave often being the strongest. Analyst Gert van Lagen predicts ADA could reach $10—or even $40 in an optimistic scenario—if it is indeed in the second corrective wave, which would be followed by a strong third wave.
What is a “Golden Cross,” and what does it indicate for Cardano’s future?
A Golden Cross occurs when the 50-day Exponential Moving Average (EMA) crosses above the 200-day EMA, typically signaling a potential bullish trend. For Cardano, this crossover could suggest upward momentum if it holds above key support levels.
What are the key support and resistance levels to watch for ADA?
Key support levels for ADA include $0.48 (38.2% Fibonacci retracement level) and the critical level of $0.40. Resistance levels to watch include the recent high of $0.6900, and $1, which is a psychological threshold that may signal a bullish trend if surpassed.
How high could Cardano go, according to analysts?
According to Gert van Lagen’s analysis, ADA could reach a base-case target of $10, representing a 1,786% increase from the current price. In an optimistic scenario aligned with Elliott Wave Theory, ADA’s price could surge up to $40, a 7,400% increase.
What risks could impact Cardano’s price growth?
Potential risks include declining Total Value Locked (TVL) on the Cardano blockchain, reduced user engagement, and failure to hold above critical support levels. These factors could undermine the bullish outlook for Cardano.
Could Cardano’s price reach $1 in the short term?
Yes, analysts suggest that if Cardano holds above the $0.6900 level and maintains strong technical support, it could rally to $1, which represents an 87% increase from current levels.
What would invalidate the bullish case for
ADA?
If ADA falls below the crucial $0.40 support level, the bullish case would be invalidated, possibly leading to further declines. In this scenario, ADA could test lower support levels, such as $0.3054.
Is now a good time to buy ADA?
The decision to buy ADA depends on individual risk tolerance, investment goals, and market analysis. While some analysts see long-term growth potential, others caution about short-term risks given the current bear market.
Where can I find live updates and analysis on Cardano price?
You can follow live updates and analyses on Cardano’s price through popular financial news platforms, cryptocurrency trading platforms, and analysis from reputable analysts on social media and forums.

Delegate Your Voting Power to FEED DRep in Cardano Governance.
DRep ID: drep12ukt4ctzmtf6l5rj76cddgf3dvuy0lfz7uky08jfvgr9ugaapz4 | We are driven to register as a DRep by our deep dedication to the Cardano ecosystem and our aspiration to take an active role in its development, ensuring that its progress stays true to the principles of decentralization, security, and community empowerment.DELEGATE VOTING POWER!


