Cardano Price Prediction Is About To Flip Very Bullish: Here's Why
Cardano price has once again hit my bullish price target. In my previous ADA analysis, I predicted the smart contract cryptocurrency to hit $0.308 after a major breakout. This target has been perfectly met...

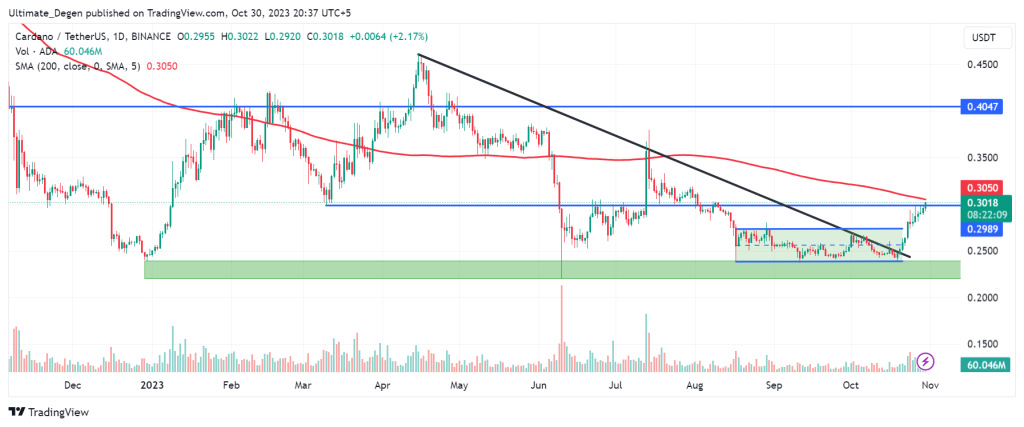
Cardano price has once again hit my bullish price target. In my previous ADA analysis, I predicted the smart contract cryptocurrency to hit $0.308 after a major breakout. This target has been perfectly met today as the price hit the daily high of $0.302.
Analysts are very bullish on the crypto prices due to the much anticipated spot Bitcoin ETF approval. Last week’s fake pump has shown what a potential approval of ETF can do to the Bitcoin price. This has resulted in traders stepping over each other to buy the pioneering digital asset before the approval from the SEC.
Consequently, Cardano price is on an absolute rampage. The price has soared 25% after hitting its monthly lows. Bulls are now eyeing another 33% gains as a clear break of $0.30 may unlock a huge upside potential. However, it may be too soon to call it a proper bullish reversal.
Since ADA is the native asset of the Cardano blockchain, its price action is directly tied to the network adoption. The slow development of the network has adversely affected the Cardano price action in the past two years. However, recent stats show that the development is accelerating as Cardano emerged as the fastest developing blockchain a few weeks ago.
Cardano Price Technical Analysis
In the last analysis, I predicted a 20% upside for ADA which was perfectly met. The latest technical analysis reveals that the coin has the potential to soar another 33% if the bulls manage to gain strength above the $0.30 resistance level. This particular level is a historic pivot for ADA price.
Therefore, I expect the Cardano price prediction to turn bullish when it breaks above 200 MA and the $0.30 level. These levels are clearly marked on the following chart. The 200 MA on the daily chart is shown as the red line while the 0.30 resistance is shown as a blue line.

Delegate Your Voting Power to FEED DRep in Cardano Governance.
DRep ID: drep12ukt4ctzmtf6l5rj76cddgf3dvuy0lfz7uky08jfvgr9ugaapz4 | We are driven to register as a DRep by our deep dedication to the Cardano ecosystem and our aspiration to take an active role in its development, ensuring that its progress stays true to the principles of decentralization, security, and community empowerment.DELEGATE VOTING POWER!


