Cardano Price Analysis: Bulls struggle to reclaim the psychological round level of $1.0
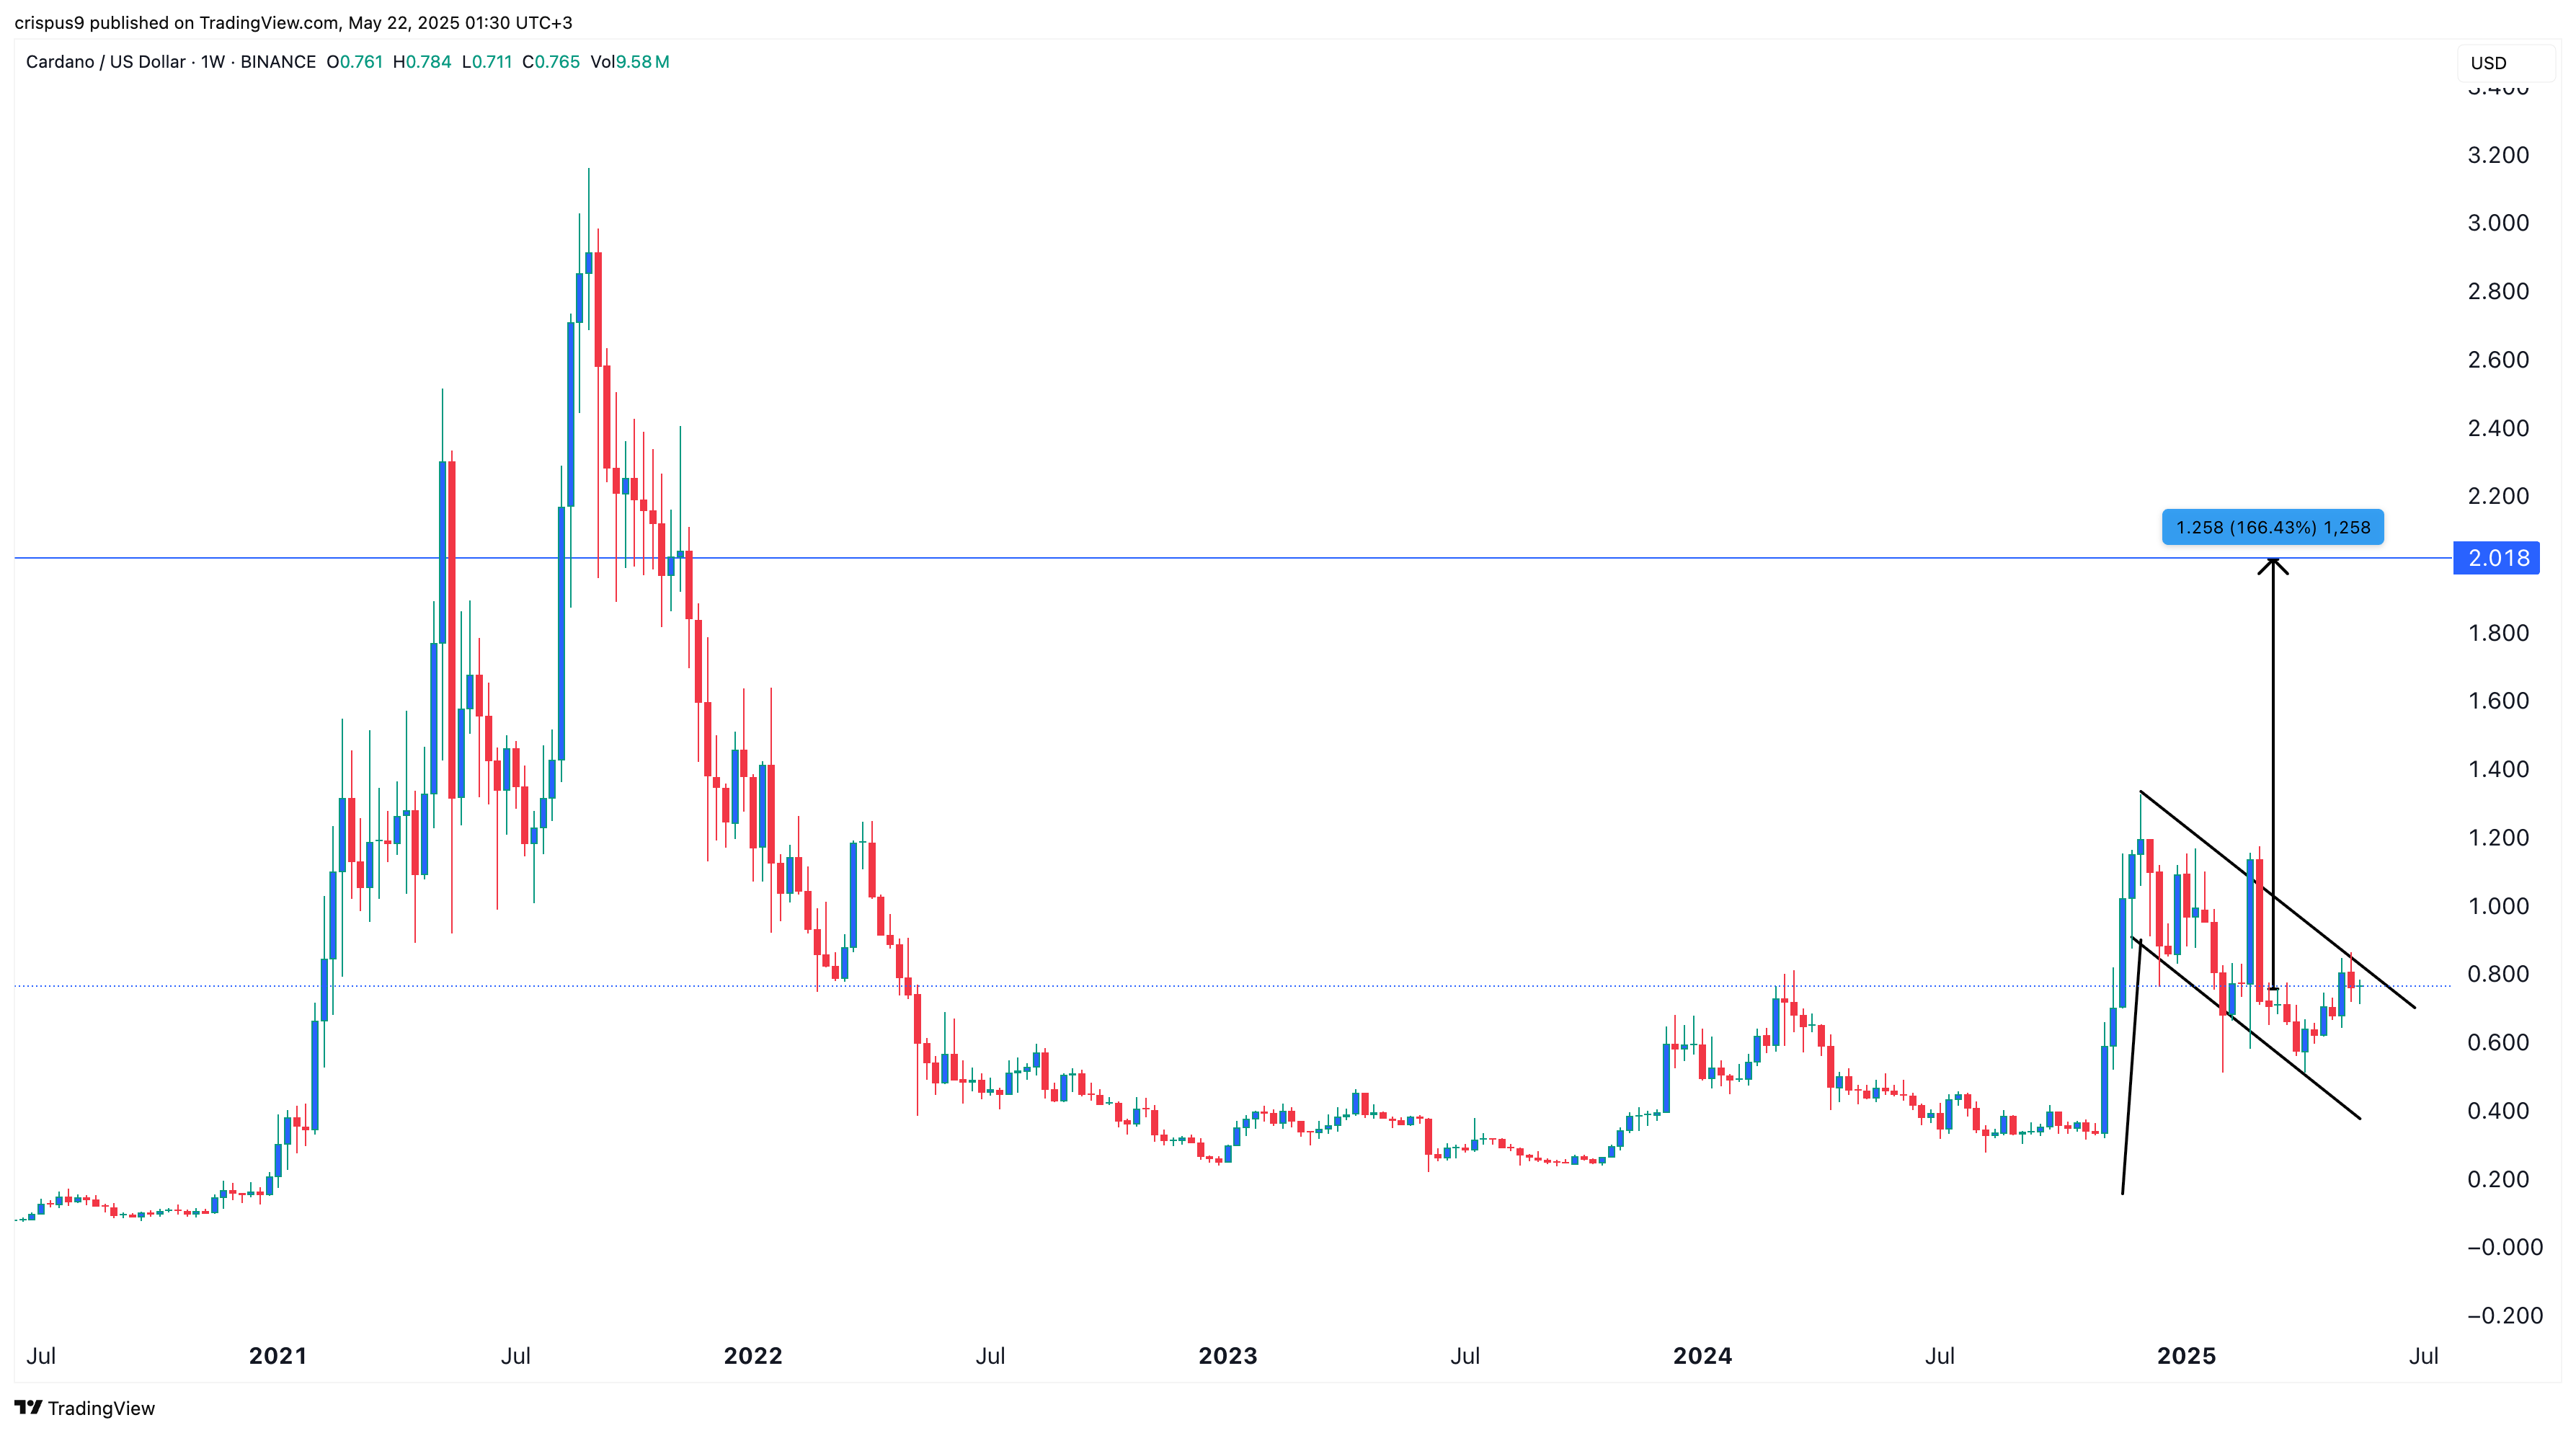
Cardano appears to be turning down after forming a double top pattern near the $1.2 mark (resistance). The ADA coin is approaching the downside of the Bollinger Bands indicator on the daily price chart. The ADA/BTC pair price is...

- Cardano appears to be turning down after forming a double top pattern near the $1.2 mark (resistance).
- The ADA coin is approaching the downside of the Bollinger Bands indicator on the daily price chart.
- The ADA/BTC pair price is showing a sideways trend at 0.00002362 Satoshis.
Cardano currency was experiencing a sell-off after falling below the $1.2-resistance level (2-month high). Last week, the Cardano coin price failed to retain the $1.0 level, with price action producing a double top below resistance ($1.2). Nonetheless, the bulls remain optimistic about ADA coins in the Loggerhead time period. As a consequence, the currency has rebounded from $0.80 to over 60% of its weekly highs.
The ADA coin shows a long legged Doji candle at the end of March on the weekly price chart before the downsloping momentum. However, ADA is reflecting the range-bound market before sliding further.
Nowadays, the bulls are barely trying to manage the ADA cost above the $0.90 mark (weekly low). At the time of writing, ADA price is down 2% at the $0.948 level. Moreover, the price of the ADA/BTC pair is showing a sideways trend at 0.00002362 Satoshis.
In the context of the daily price chart, ADA price is on a downside with the Bollinger Bands indicator. The semi-line (20-day moving average) of the BB indicator could act as a bullish barrier for the upcoming trading sessions. However, the intraday trading volume gradually decreased and reached $805 million.
Accumulation phase is on the way with ADA
With reference to the daily price chart, the RSI indicator is present at 42 Mark (Rain). However, the RSI is still falling in the oversold zone, causing panic among buyers.
Similarly, the MACD indicator started turning lower after a bearish crossover. But still the daily MACD indicator shines above the neutral zone (in the positive zone).
Conclusion
Cardano (ADA) coin price trend is consolidating between $1.0-resistance and $0.90-support. breakout of this horizontal range may lead in a further directional trend upward or downward.
Support level – $0.9 and $0.80
Resistance level – $1.0 and $1.6
Disclaimer
The views and opinions stated by the author, or any people named in this article, are for informational ideas only, and they do not establish the financial, investment, or other advice. Investing in or trading crypto assets comes with a risk of financial loss.
Delegate Your Voting Power to FEED DRep in Cardano Governance.
DRep ID: drep12ukt4ctzmtf6l5rj76cddgf3dvuy0lfz7uky08jfvgr9ugaapz4 | We are driven to register as a DRep by our deep dedication to the Cardano ecosystem and our aspiration to take an active role in its development, ensuring that its progress stays true to the principles of decentralization, security, and community empowerment.DELEGATE VOTING POWER!


