Cardano Price Analysis: ADA/USD Takes Deeper Dig
Cardano Price Analysis – December 3 The Cardano price takes a deep dig and slides to $1.51 but the coin is expected to recover back above the 9-day moving average. ADA/USD Market Key Levels: Resistance levels: $1.85, $1.90, $2.00...
Cardano Price Analysis – December 3
The Cardano price takes a deep dig and slides to $1.51 but the coin is expected to recover back above the 9-day moving average.
ADA/USD Market
Key Levels:
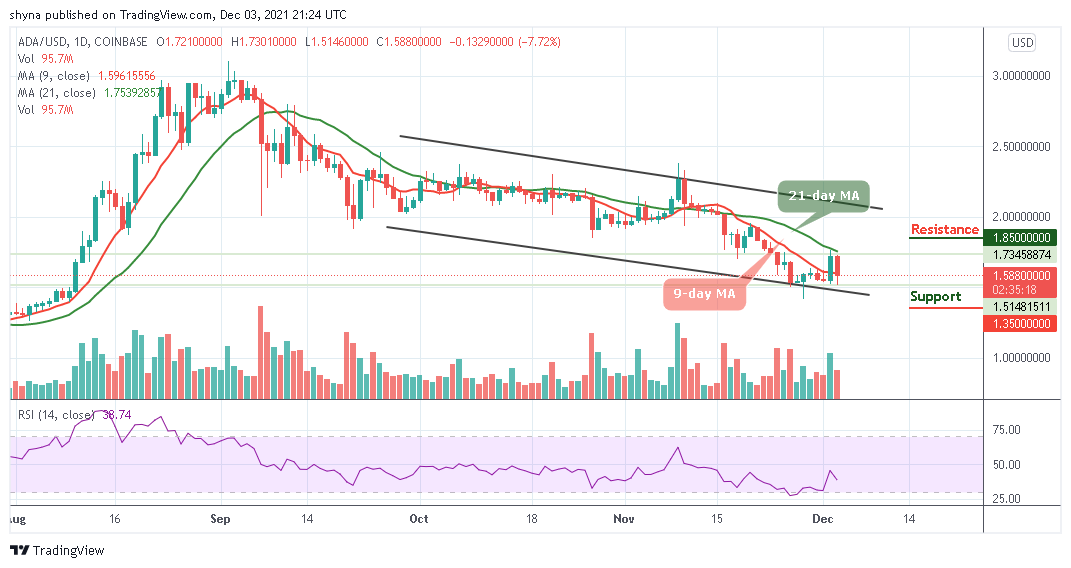
Resistance levels: $1.85, $1.90, $2.00
Support levels: $1.35, $1.30, $1.25
ADAUSD – Daily ChartADA/USD is seen sliding below the 9-day and 21-day moving averages as the traders were deeply in losses. After a bullish movement today, the Cardano price begins the intra-day trading with a cross below the 9-day moving average. ADA/USD has been range-bounding towards the lower boundary of the channel. It may take some time for ADA/USD to come out of the bearish zone as the technical indicator RSI (14) moves below 45-level.
Cardano Price Analysis: Cardano Price Ready to Break Beneath
At the moment, the market is trading below the 9-day and 21-day moving averages. If we can see an increasing volume coupled with a bullish regroup, the Cardano price may start to correct gain significantly on the upside. Otherwise, the bear pressure will become severe with more losses within the market.
However, the Cardano price is expected to retest resistance at $1.70 before the rally continues. Watching out for the next key resistance; the $1.85, $1.90, and $2.00 levels seem closer for the bull sides. In the opposite direction, the ADA/USD pair may roll back to $1.50 support if the bears step back in the market fully. A break the lower boundary of the channel could establish a new low at $1.35, $1.30, and $1.25.
ADA/BTC Market: Price May Gain More Downtrend
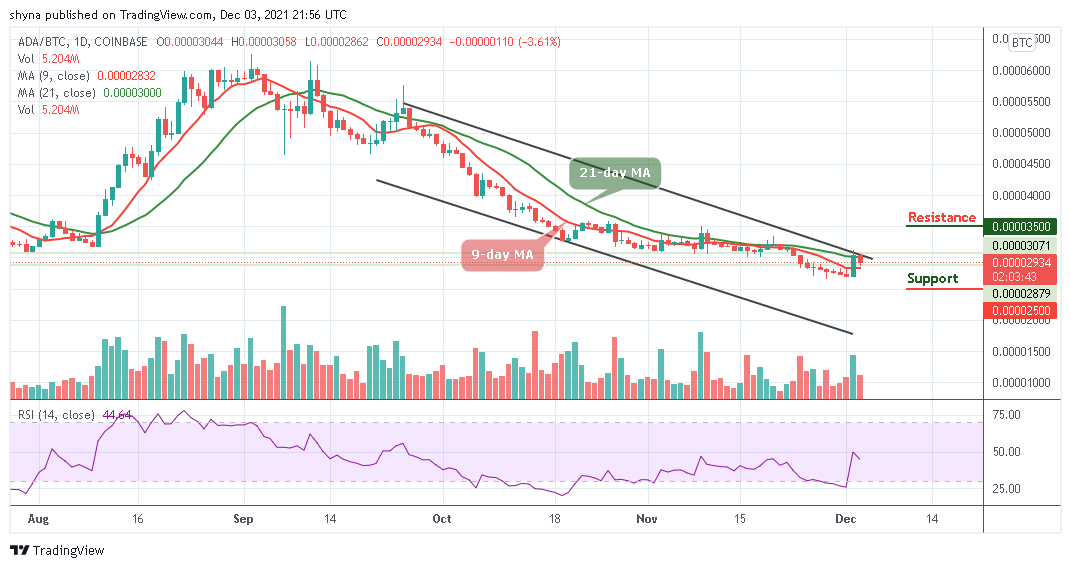
Pairing with Bitcoin, the Cardano price says within the 9-day and 21-day moving averages. Although the price is still unstable as the coin continues to trade at a price level of 2934 SAT. Therefore, a low swing could reach the 2700 SAT towards the lower boundary of the channel.
 ADABTC – Daily Chart
However, should in case the pair crosses down the support at 2700 SAT, additional support may be created at 2500 SAT and below. In other words, on the upside, a rebound may likely occur as the bullish sides could strongly defend the 2900 level and push the price to 3500 SAT resistance level and above. But for now, the bears are gaining ground while they are declining as the Relative Strength Index (14) moves below 50-level.
Delegate Your Voting Power to FEED DRep in Cardano Governance.
DRep ID: drep12ukt4ctzmtf6l5rj76cddgf3dvuy0lfz7uky08jfvgr9ugaapz4 | We are driven to register as a DRep by our deep dedication to the Cardano ecosystem and our aspiration to take an active role in its development, ensuring that its progress stays true to the principles of decentralization, security, and community empowerment.DELEGATE VOTING POWER!

![L'hyperliquide vole avec le pétrole : sur le DEX aujourd'hui, le brut dépasse les 100 dollars [Analisi] - La Crypto Monnaie](https://www.criptovaluta.it/wp-content/uploads/2026/03/BTCUSDT_2026-03-14_09-17-45-1024x568.png.webp)