Cardano Price Analysis: ADA/USD Stalls Above $1.40 Level
Cardano Price Analysis – December 8 The Cardano price is consolidating around $1.402 after recording a 1.71% gain as buying pressure may bring the market back above the moving averages. ADA/USD Market Key Levels: Resistance levels: $1.70, $1.90, $2.10...

Cardano Price Analysis – December 8
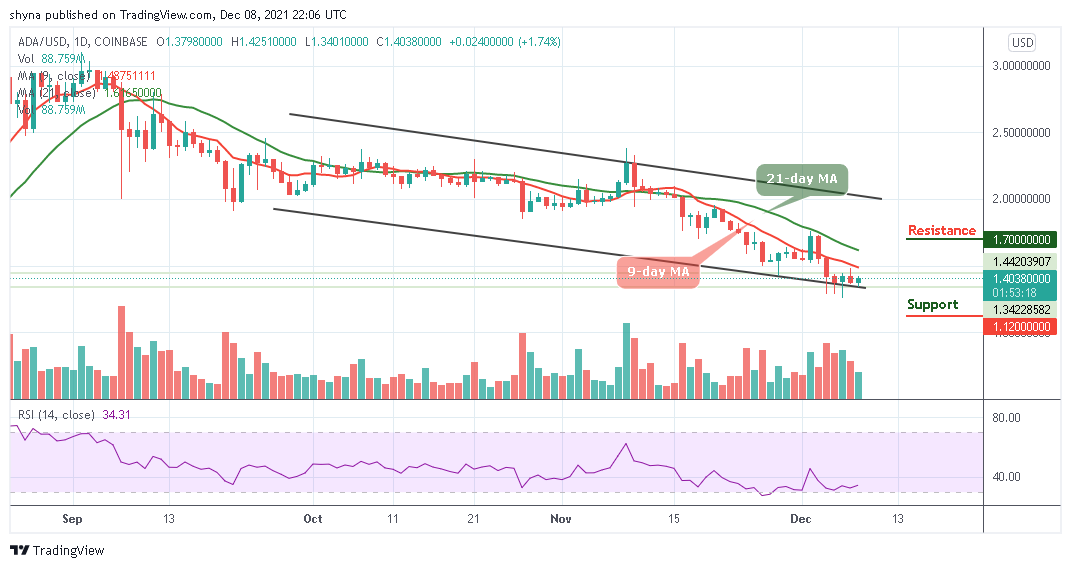
The Cardano price is consolidating around $1.402 after recording a 1.71% gain as buying pressure may bring the market back above the moving averages.
ADA/USD Market
Key Levels:
Resistance levels: $1.70, $1.90, $2.10
Support levels: $1.12, $0.90, $0.70
 ADAUSD – Daily Chart
ADA/USD is trying to rise towards the 9-day moving average after the fall of yesterday, closing at $1.36 and today, the coin is seen approaching major resistance at $1.45. The current price trend suggests a growth momentum in the coming days. Meanwhile, the Cardano price is hovering at $1.40 as the coin remains within the channel.
Cardano Price Analysis: What to Expect from Cardano (ADA)
If the Cardano price can experience an increasing volume coupled with a bullish regroup, ADA/USD may start to correct gain significantly on the upside. Otherwise, the bear pressure may likely become severe with more losses. However, the next level of support lies at $1.12, $0.90, and $0.70.
Looking at the daily chart, ADA price may continue the bullish movement as the coin may touch the resistance levels of $1.70, $1.90, and $2.10 if the bulls step back into the market. The technical indicator Relative Strength index (14) makes a quick bullish turn around 33-level which may likely give more positive signals in the nearest term.
ADA/BTC Market: Price May Continue with the Sideways Movement
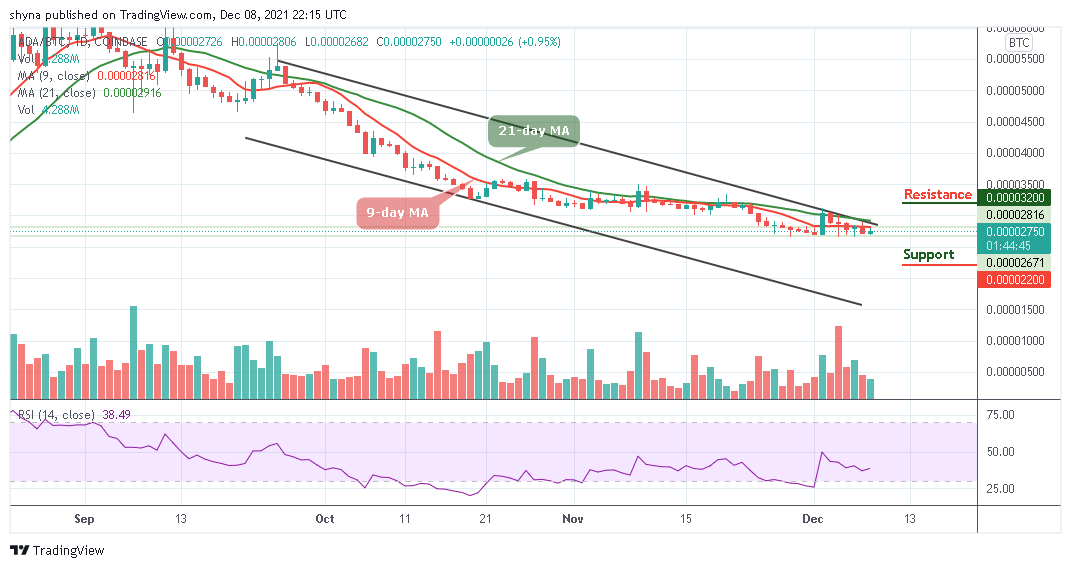
When compares with Bitcoin, the market is seen below the 9-day and 21-day moving averages as revealed in the daily chart. Should the price break above the upper side of the channel, the market may experience an upward trend which may likely touch the nearest resistance level at 3200 SAT and above.
 ADABTC – Daily Chart
Meanwhile, if ADA price keeps moving towards the south, it may likely reach the support at 2200 SAT and below. However, the technical indicator Relative Strength Index (14) confirms that the market is moving below 40-level which may give more bearish signals in the next negative movements.
Delegate Your Voting Power to FEED DRep in Cardano Governance.
DRep ID: drep12ukt4ctzmtf6l5rj76cddgf3dvuy0lfz7uky08jfvgr9ugaapz4 | We are driven to register as a DRep by our deep dedication to the Cardano ecosystem and our aspiration to take an active role in its development, ensuring that its progress stays true to the principles of decentralization, security, and community empowerment.DELEGATE VOTING POWER!


