Cardano Price Analysis: ADA/USD Slumps as Price Drops by 4.92%
Cardano Price Analysis – June 18 The Cardano price slips today as the market price drops to touch the daily low of $1.35. ADA/USD Market Key Levels: Resistance levels: $1.82, $1.87, $1.92 Support levels: $1.12, $1.08, $1.03 ADA/USD has...
Cardano Price Analysis – June 18
The Cardano price slips today as the market price drops to touch the daily low of $1.35.
ADA/USD Market
Key Levels:
Resistance levels: $1.82, $1.87, $1.92
Support levels: $1.12, $1.08, $1.03
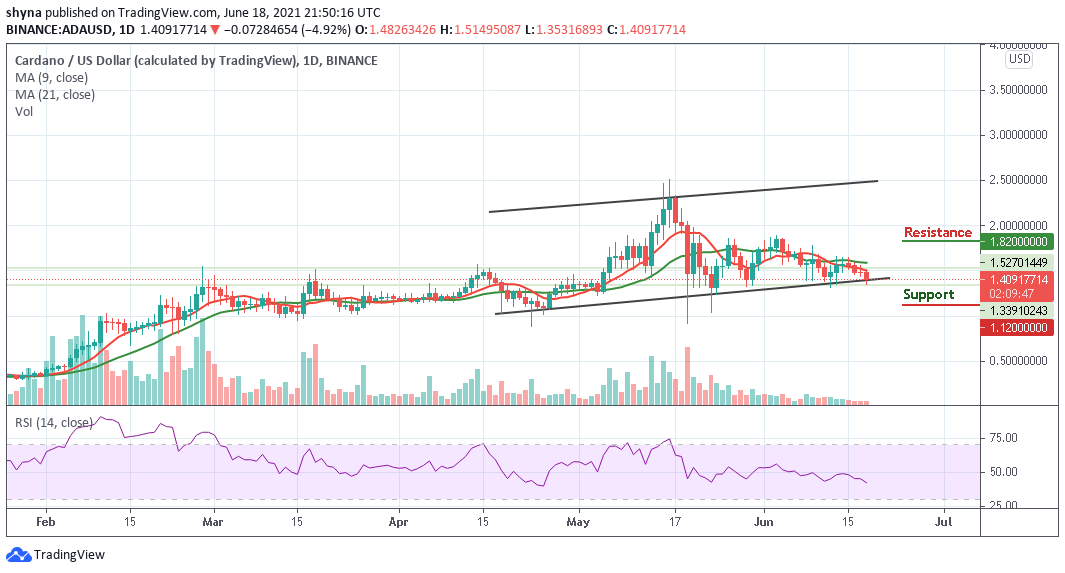
ADAUSD – Daily ChartADA/USD has not been performing quite well for the past few weeks. However, the last few days brought an escalation in the price of ADA coin as the whole market has been confronted with a bearish movement. Meanwhile, the buyers keep the movement intact within the channel as the market range-bounds. The same reflects that the coin has pretty good potential until today that it drops to touch the daily low of $1.35 below the lower boundary of the channel.
Cardano Price Analysis: What Could Be the Next Direction?
Looking at the daily chart, if the Cardano price decides to stay below the 9-day and 21-day moving averages and under the control of bears, the coin may likely drop to the critical supports at $1.12, $1.08, and $1.03. Whereas, on the upside, the bulls need to push the Cardano price above the 9-day and 21-day moving averages which may likely reach the resistance levels of $1.82, $1.87, and $1.92. Moreover, the technical indicator Relative Strength Index (14) is seen moving below the 45-level, which may begin to introduce bearish signals into the market soon.
ADA/BTC Market: Price Might Dip to 3400 SAT
By comparing with Bitcoin, the ADA price is seen hovering below the 9-day and 21-day moving averages within the channel where the price is expected to continue to follow the bearish movement by crossing below the lower boundary of the channel. More so, should the price remain at the downside, the Cardano price could hit the nearest support level of 3200 SAT and below.
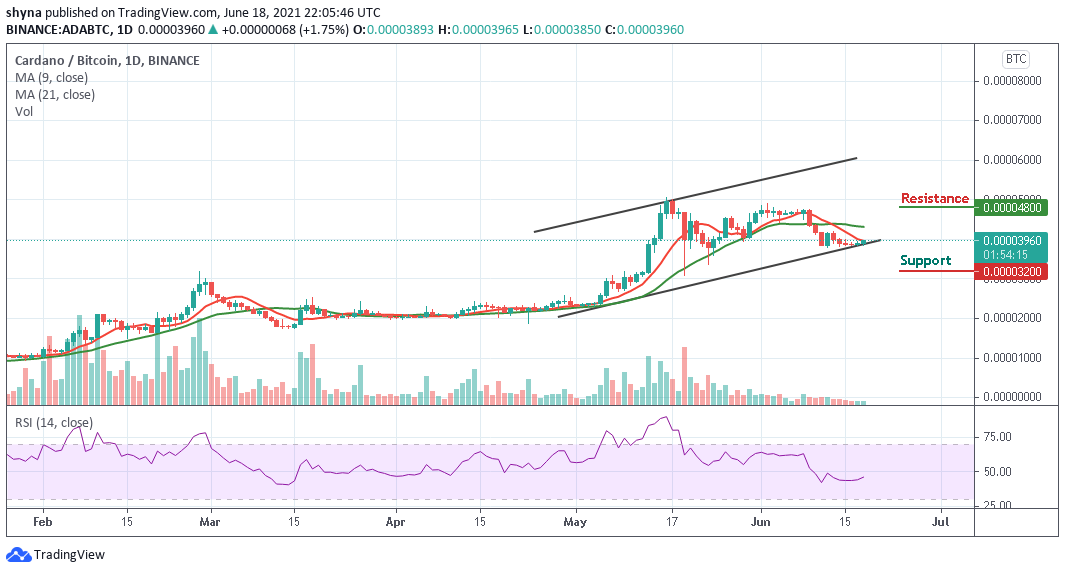 ADABTC – Daily Chart
On the contrary, if the bulls push the market to the north and cross above the 9-day and 21-day moving averages, ADA price may reach the resistance level of 4800 SAT and above. Meanwhile, the technical indicator Relative Strength Index (14) confirms that the market could begin an upward movement as the signal line moves toward 50-level.
Delegate Your Voting Power to FEED DRep in Cardano Governance.
DRep ID: drep12ukt4ctzmtf6l5rj76cddgf3dvuy0lfz7uky08jfvgr9ugaapz4 | We are driven to register as a DRep by our deep dedication to the Cardano ecosystem and our aspiration to take an active role in its development, ensuring that its progress stays true to the principles of decentralization, security, and community empowerment.DELEGATE VOTING POWER!