Cardano Price Analysis: ADA/USD Slides Below $0.99 Level
Cardano Price Analysis – February 21 The Cardano (ADA) continues to slide below the 9-day and 21-day moving averages since the opening of today’s trading. ADA/USD Market Key Levels: Resistance levels: $1.30, $1.40, $1.50 Support levels: $0.60, $0.50, $0.40...
Cardano Price Analysis – February 21
The Cardano (ADA) continues to slide below the 9-day and 21-day moving averages since the opening of today’s trading.
ADA/USD Market
Key Levels:
Resistance levels: $1.30, $1.40, $1.50
Support levels: $0.60, $0.50, $0.40
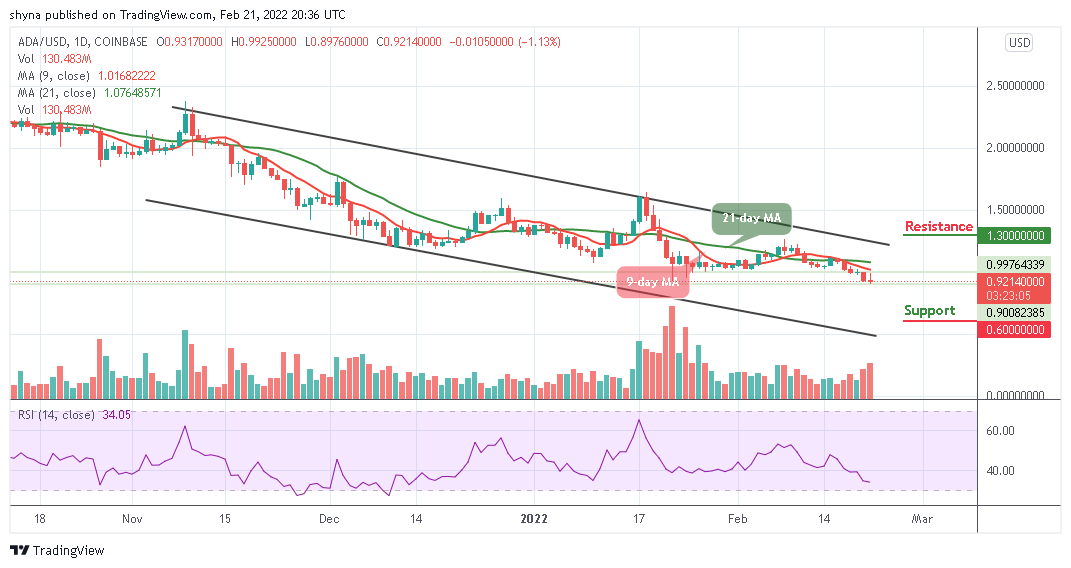
ADAUSD – Daily ChartAt the time of writing, ADA/USD is hovering at $0.92, which is now subjected to the price actions below the 9-day and 21-day moving averages over the past few days of trading. If the bears continue to take charge, the coin may be losing momentum to the lower side of the channel along with a potential price surge. Meanwhile, the technical indicator Relative Strength Index (14) stays below 40-level and may continue to issue sell signals.
Cardano Price Analysis: ADA Price May Continue to Move Down
Looking at the daily chart, the Cardano price is moving downward as the coin faces the lower boundary of the channel. However, if the coin decides to stay under the control of bears, the price may likely drop more to hit the nearest supports at $0.60, $0.50, and $0.40 respectively. On the upside, for the market to create an uptrend, the bulls need to push the market price above the 9-day and 21-day moving averages before locating the potential resistance levels at $1.30, $1.40, and $1.50.
ADA/BTC Market: Cardano Price Keeps Ranging
Against Bitcoin, the market is seen to be moving below the 9-day and 21-day moving averages and within the channel where the price is expected to break towards the lower boundary of the channel. However, should the price cross below the channel, the market could experience more downtrends that may hit the key support level of 2000 SAT and below.
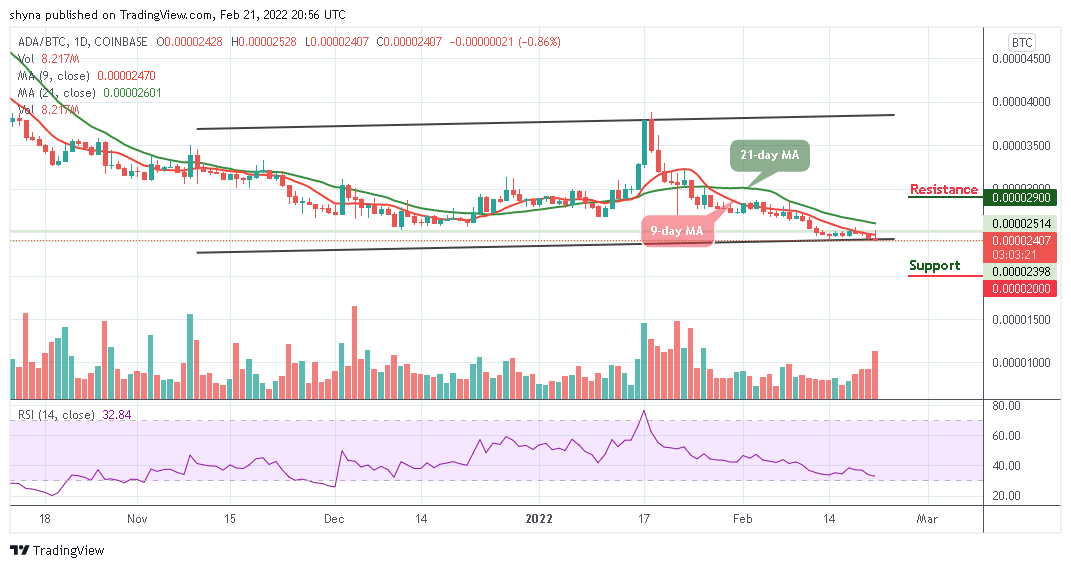 ADABTC – Daily Chart
On the contrary, if the bulls could manage and push the market above the moving averages, the Cardano price may reach the resistance level of 2900 SAT and above. More so, the technical indicator Relative Strength Index (14) confirms that the market is been controlled by the sellers as the signal line remains below 40-level.
Delegate Your Voting Power to FEED DRep in Cardano Governance.
DRep ID: drep12ukt4ctzmtf6l5rj76cddgf3dvuy0lfz7uky08jfvgr9ugaapz4 | We are driven to register as a DRep by our deep dedication to the Cardano ecosystem and our aspiration to take an active role in its development, ensuring that its progress stays true to the principles of decentralization, security, and community empowerment.DELEGATE VOTING POWER!