Cardano Price Analysis: ADA/USD Revisits the Previous Support at $1.25
Cardano Price Analysis – July 29 As it stands now, the ADA market is volatile, with prices recovering from $1.25 to trade at $1.27. ADA/USD Market Key Levels: Resistance levels: $1.45, $1.50, $1.55 Support levels: $1.10, $1.05, $1.00 ADA/USD...

Cardano Price Analysis – July 29
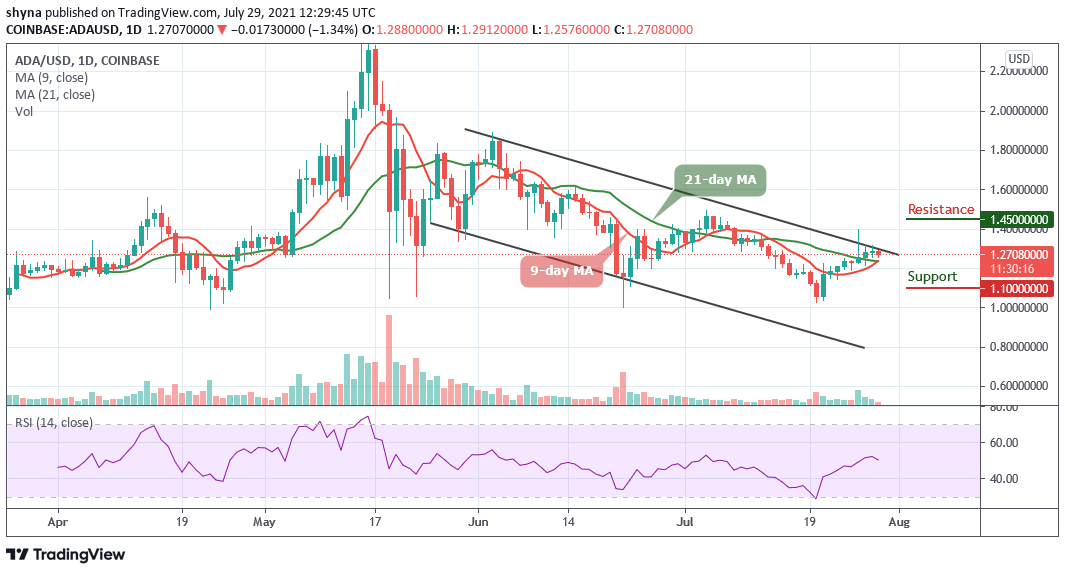
As it stands now, the ADA market is volatile, with prices recovering from $1.25 to trade at $1.27.
ADA/USD Market
Key Levels:
Resistance levels: $1.45, $1.50, $1.55
Support levels: $1.10, $1.05, $1.00

ADA/USD is currently trading at $1.27 as the bears delay the coin from crossing above the upper boundary of the channel. A few days ago, the Cardano price encountered higher resistance at $1.40 and fell down. Cardano (ADA) is down by 1.34% of its value and the downside momentum may be gaining traction. Therefore, the coin can break below the 9-day and 21-day moving averages to test the $0.15 level.
Cardano Price Analysis: ADA Price May Push Higher
At the time of writing, ADA/USD is changing hands at $1.27 as the coin keeps trading above the 9-day and 21-day moving averages with a 1.34% loss since the start of the day, though it is still following a sideways movement on a day-to-day basis, the Relative Strength Index (14) faces the south. On the intraday chart, ADA/USD may move below the moving averages with the next support at $1.15.
However, a sustainable move below this area could worsen the short-term technical picture and allow for an extended decline towards $1.10, $1.05, and a psychological $1.00 supports. On the upside, a return above $1.40 may help to mitigate the immediate bearish pressure. The price could return inside the previous consolidation range and get a chance to cross above the moving averages at $1.45, $1.50, and $1.55 resistance levels.
ADA/BTC Market: Bears are Flexing their Muscles
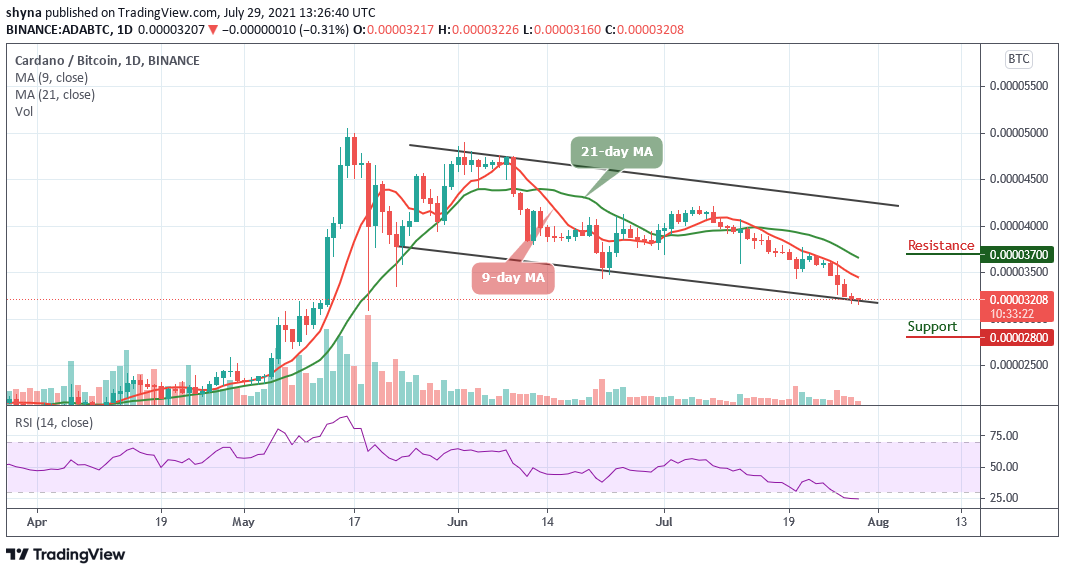
Against BTC, the direction of the market is following a downward trend. Although the price is still unstable; trading at a price level of 3208 SAT. A low swing could reach the 2800 SAT support level and below, creating a new low for this month. For now, the bears are gaining ground while they are declining; now slowly in action as the Relative Strength Index (14) is moving within the oversold region.
 ADABTC – Daily Chart
In other words, a rebound is likely to occur if the signal line moves out of the oversold region and the coin cross above the 9-day and 21-day moving averages to reach the potential resistance at 3700 SAT and above.
Delegate Your Voting Power to FEED DRep in Cardano Governance.
DRep ID: drep12ukt4ctzmtf6l5rj76cddgf3dvuy0lfz7uky08jfvgr9ugaapz4 | We are driven to register as a DRep by our deep dedication to the Cardano ecosystem and our aspiration to take an active role in its development, ensuring that its progress stays true to the principles of decentralization, security, and community empowerment.DELEGATE VOTING POWER!


