Cardano Price Analysis: ADA/USD May Head to the South
Cardano Price Analysis – January 13 The Cardano price is down by 4.99% after touching the daily high of $1.35 while the next support of the coin may likely come at $1.20 level. ADA/USD Market Key Levels: Resistance levels:...
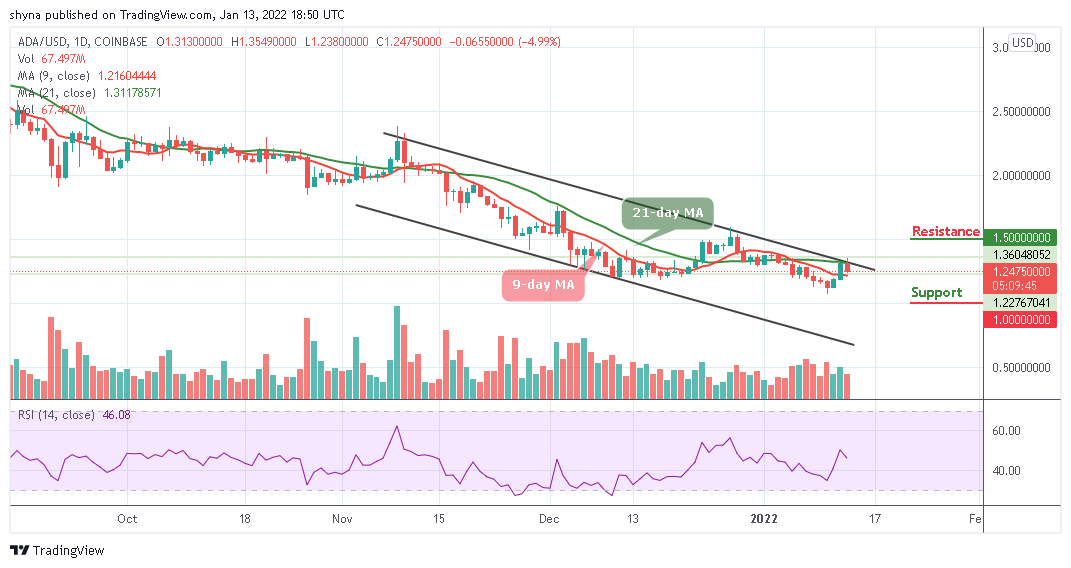
Cardano Price Analysis – January 13
The Cardano price is down by 4.99% after touching the daily high of $1.35 while the next support of the coin may likely come at $1.20 level.
ADA/USD Market
Key Levels:
Resistance levels: $1.50, $1.60, $1.70
Support levels: $1.00, $0.90, $0.80
ADAUSD – Daily ChartADA/USD is falling beneath towards the 9-day moving average after crossing above the upper boundary of the channel during the European session today. As the bears step back into the market, the coin may lose momentum to the lower side of the channel along with a potential price surge. Meanwhile, the technical indicator Relative Strength Index (14) on the daily chart is bearish and may continue to issue sell signals.
Cardano Price Analysis: Cardano (ADA) Ready to Drop More
According to the daily chart, if the Cardano price decides to stay under the control of bears, the price may likely drop below the 9-day moving average which could reach the nearest supports at $1.00, $0.90, and $0.80 respectively. On the upside, if the bulls push the Cardano price above the upper boundary of the channel, it may likely touch the nearest resistance level at $1.40 while the further bullish movement may hit the resistance levels at $1.50, $1.60, and $1.70.
ADA/BTC Market: Price Keeps moving Sideways
When compares with Bitcoin, the Cardano market is seen to be moving above the 9-day and 21-day moving averages within the channel where the price is expected to break above the upper boundary of the channel. Therefore, should the price cross below the moving averages, the market could experience more downtrends that may touch the critical support level of 2700 SAT and below.
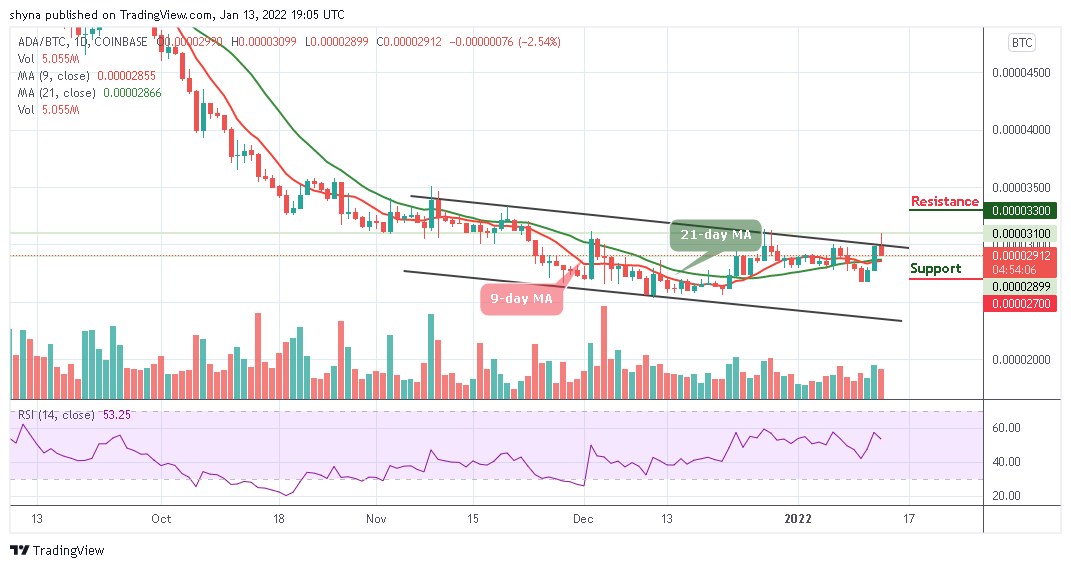 ADABTC – Daily Chart
On the contrary, if the bulls could manage and push the market to the upside, it may cross above the upper boundary of the channel. If successful, ADA/BTC may reach the resistance level of 3300 SAT and above. More so, at the time of writing, the technical indicator Relative Strength Index (14) confirms that the market is been controlled by the sellers as the signal line nosedives below 60-level.
SNEKbot by DexHunter on CARDANO
Cardano's Telegram Trading Bot live on Cardano mainnet!TRADE NOW!