Cardano Price Analysis: ADA/USD Initiates Price Recovery with a 21.73% Gain
ADA Price Analysis – May 13 As the daily chart reveals, ADA/USD is rising to a crucial resistance level at $2.0 and at the same time breaking above the upper boundary of the channel. ADA/USD Market Key Levels: Resistance...
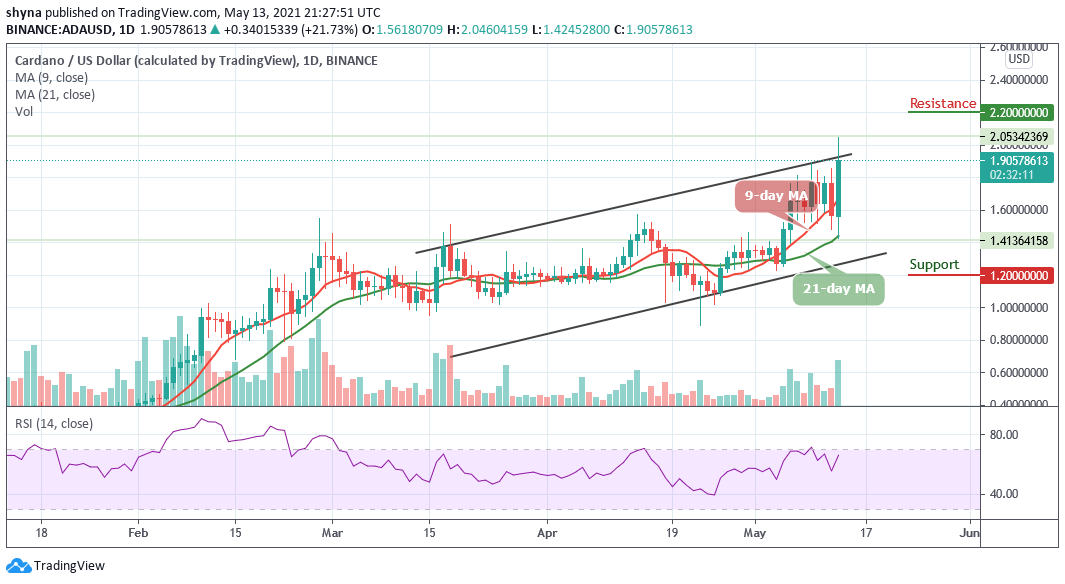
ADA Price Analysis – May 13
As the daily chart reveals, ADA/USD is rising to a crucial resistance level at $2.0 and at the same time breaking above the upper boundary of the channel.
ADA/USD Market
Key Levels:
Resistance levels: $2.20, $2.30, $2.40
Support levels: $1.20, $1.10, $1.00
ADAUSD – Daily ChartADA/USD price touches the daily high of $2.04 and it is recording a surge of over 21% in the last 24 hours moving from the daily low of $1.42. However, it may move past the upper boundary of the channel in the nearest term and may remain above the 9-day and 21-day moving averages. The lowest recorded price that ADA has touched this month was $1.22. In the next few days, the Cardano price may fly to the upside if the bulls keep putting more pressure.
What to Expect from Cardano (ADA)
If ADA/USD stays under the control of bears, it could drop below the lower boundary of the channel to test the critical supports at $1.20, $1.10, and $1.00. On the upside, the bulls need to keep the market price above the channel, by doing so, the coin may hit the potential resistance at $2.20, $2.30, and $2.40 levels as the technical indicator RSI (14) moves above the 65-level, suggesting more bullish signals.
ADA/BTC Market: Keeps the Uptrend Intact
Against Bitcoin, the coin is seen to be trading above the 9-day and 21-day moving averages and within the channel where the price is expected to break the upper boundary of the channel. However, should the price cross above the channel, the market could experience additional uptrends that may touch the nearest resistance level of 4300 SAT and above.
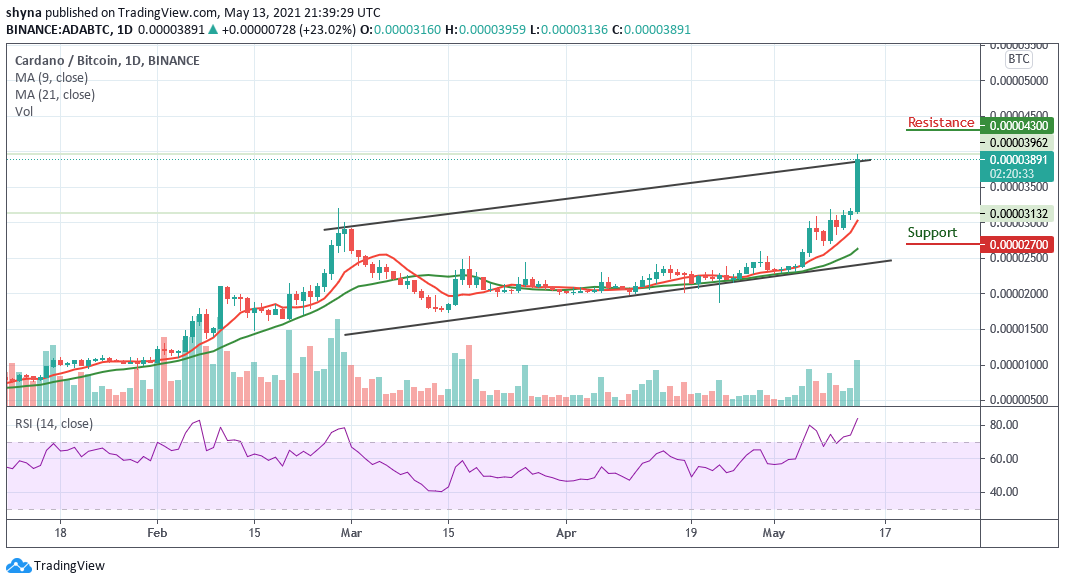 ADABTC – Daily Chart
On the other hand, if the bears could push the market below the 9-day moving average then, ADA price may reach the support level of 2700 SAT and above. Meanwhile, the Relative Strength Index (14) indicator confirms that the market is been controlled by the bulls as the signal line crosses above 80-level within the overbought zone, indicating more positive movements.
Delegate Your Voting Power to FEED DRep in Cardano Governance.
DRep ID: drep12ukt4ctzmtf6l5rj76cddgf3dvuy0lfz7uky08jfvgr9ugaapz4 | We are driven to register as a DRep by our deep dedication to the Cardano ecosystem and our aspiration to take an active role in its development, ensuring that its progress stays true to the principles of decentralization, security, and community empowerment.DELEGATE VOTING POWER!