Cardano Price Analysis: ADA/USD Goes Up as Price Set to Climb $0.60 Resistance
ADA Price Analysis – February 5 The Cardano bulls are taking charge of the market as the coin trades at $0.53. ADA/USD Market Key Levels: Resistance levels: $0.65, $0.70, $0.75 Support levels: $0.35, $0.30, $0.25 ADA/USD could reach $0.70...

ADA Price Analysis – February 5
The Cardano bulls are taking charge of the market as the coin trades at $0.53.
ADA/USD Market
Key Levels:
Resistance levels: $0.65, $0.70, $0.75
Support levels: $0.35, $0.30, $0.25
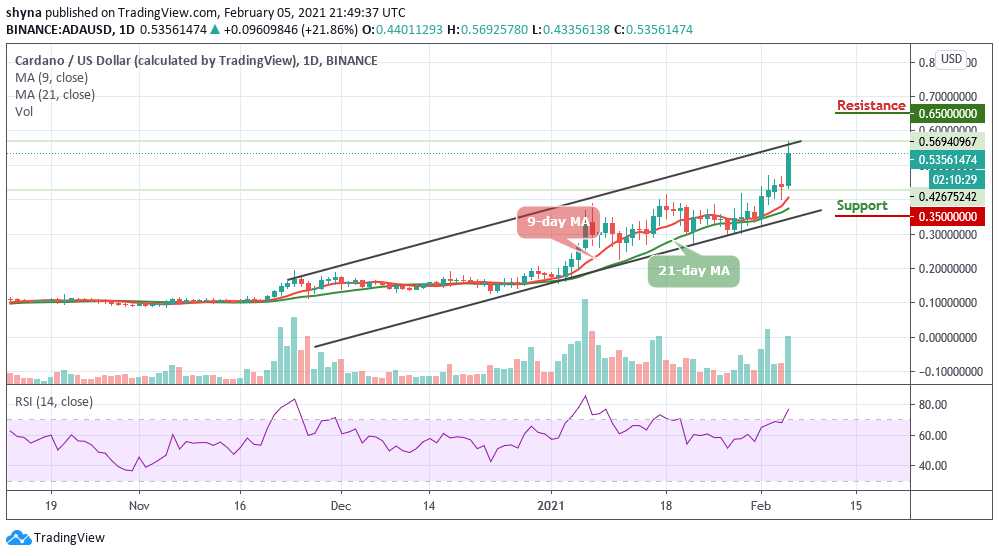 ADAUSD – Daily Chart
ADA/USD could reach $0.70 in the coming week, according to current speculations. The difficult phase seems to be over for this crypto, as it is making an attempt to create a new trend. However, ADA price is currently trading at $0.53 as of writing this, although the coin touched $0.56 when the market opens early today but may likely retest the $0.50 before moving upward again.
What Could Be the Next Direction for ADA/USD?
It is apparent that a break above $0.60 could encourage more buyers to increase their entries, eventually pushing the price above $0.65, $0.70, and $0.75 resistance levels. On the downside, once the price breaks below the 9-day and 21-day moving averages, the sell-off is likely to gain traction with the next focus below the $0.45, followed by the psychological $0.40 support.
Moreover, if the above mentioned-support is broken, the downside pressure may increase while the next support may be created by $0.35, $0.30, and $0.25. The technical indicator RSI (14) moves into the overbought, suggesting additional bullish signals.
ADA/BTC Market: Flies Up Amidst Bullish Dominance
Against BTC, the Cardano price is making an attempt to cross above the upper boundary of the channel. Meanwhile, a daily close above the resistance level of 1500 SAT could encourage the bulls to extend the rally towards 1700 SAT and $1800 SAT.
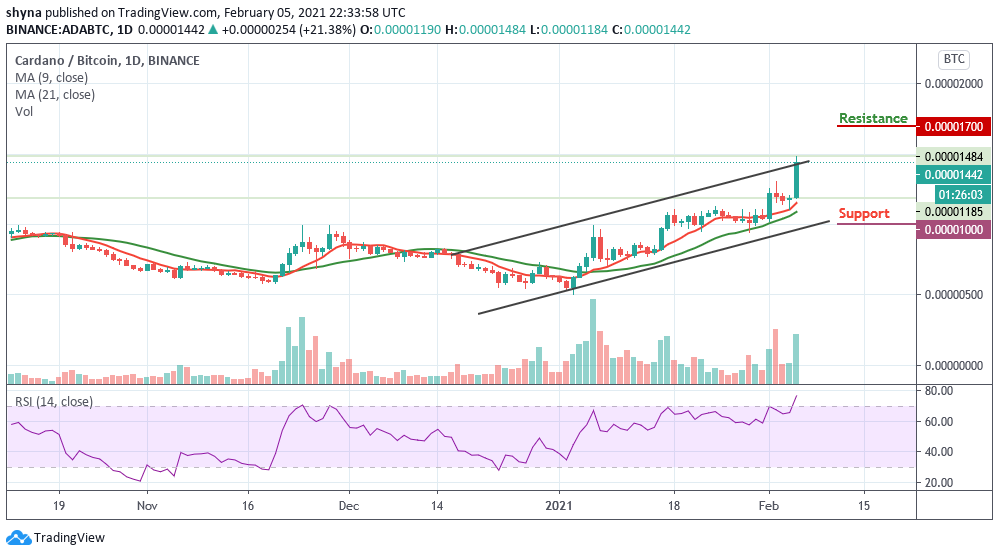 ADABTC – Daily Chart
On the other hand, a close below the 9-day and 21-day moving averages could reverse the price direction towards the daily support at 1050 SAT, further bearish movement could take the coin to the support of 1000 SAT and below. There is a possibility that the price may continue the bullish trend as the technical indicator RSI (14) is seen moving into the overbought region with the signal line pointing to the north.
Delegate Your Voting Power to FEED DRep in Cardano Governance.
DRep ID: drep12ukt4ctzmtf6l5rj76cddgf3dvuy0lfz7uky08jfvgr9ugaapz4 | We are driven to register as a DRep by our deep dedication to the Cardano ecosystem and our aspiration to take an active role in its development, ensuring that its progress stays true to the principles of decentralization, security, and community empowerment.DELEGATE VOTING POWER!