Cardano Price Analysis: ADA/USD Declines Below $0.90 Level
Cardano Price Analysis – April 25 At the time of writing, the Cardano (ADA) is heading to the downside, with prices fluctuating below the moving averages. ADA/USD Market Key Levels: Resistance levels: $1.10, $1.15, $1.20 Support levels: $0.65, $0.60,...
Cardano Price Analysis – April 25
At the time of writing, the Cardano (ADA) is heading to the downside, with prices fluctuating below the moving averages.
ADA/USD Market
Key Levels:
Resistance levels: $1.10, $1.15, $1.20
Support levels: $0.65, $0.60, $0.55
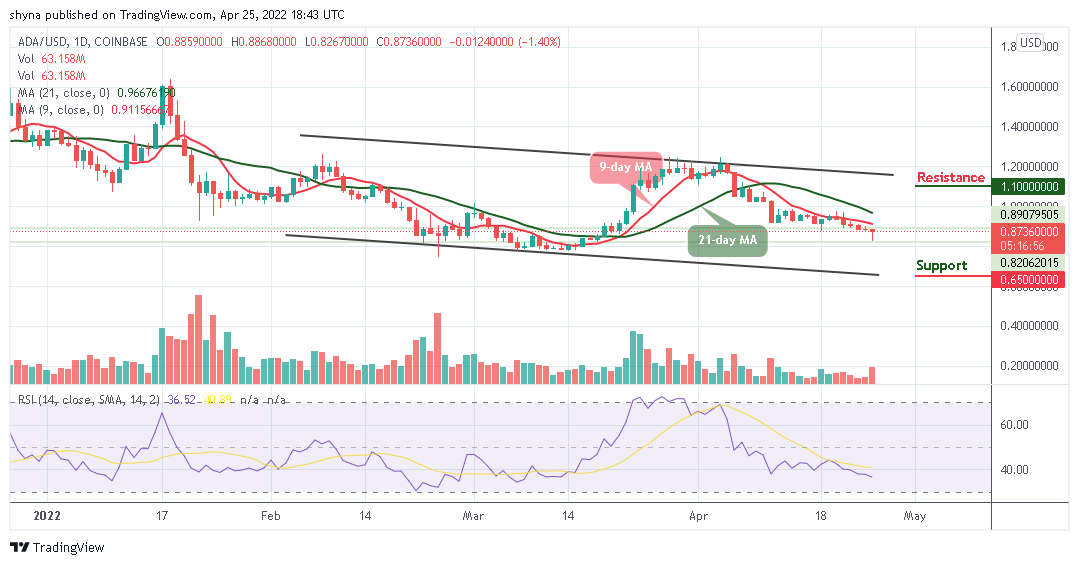
ADAUSD – Daily ChartAt the time of writing, ADA/USD is in a decline mode as the price is following the downward movement below the 9-day and 21-day moving averages. Meanwhile, the coin touches the previous support at $0.82 while a potential pullback may likely take the price up to retest the $0.90 resistance level above the 9-day moving average.
Cardano Price Analysis: Cardano Price Not Ready for the Uptrend
As the daily chart reveals, if the Cardano price stays below the 9-day and 21-day moving averages, the price may likely drop towards the lower boundary of the channel to face the support levels at $0.65, $0.60, and $0.55. On the upside, the bulls need to push the price towards the upper boundary of the channel, and this could reach the resistance levels at $1.10, $1.15, and $1.20.
Meanwhile, the technical indicator, the Relative Strength Index (14) is seen moving below 40-level. Therefore, if the coin crosses above the 9-day moving average, the bulls may introduce bullish signals into the market.
ADA/BTC Market: Cardano Price May Remain Sideways
When compared with Bitcoin, the coin is also seen heading to the downside below 9-day and 21-day moving averages. Now, the Cardano price prepares for more downtrends. Therefore, any effort by the sellers to keep the price at the downside may likely bring the coin to the support level of 1600 SAT and below.
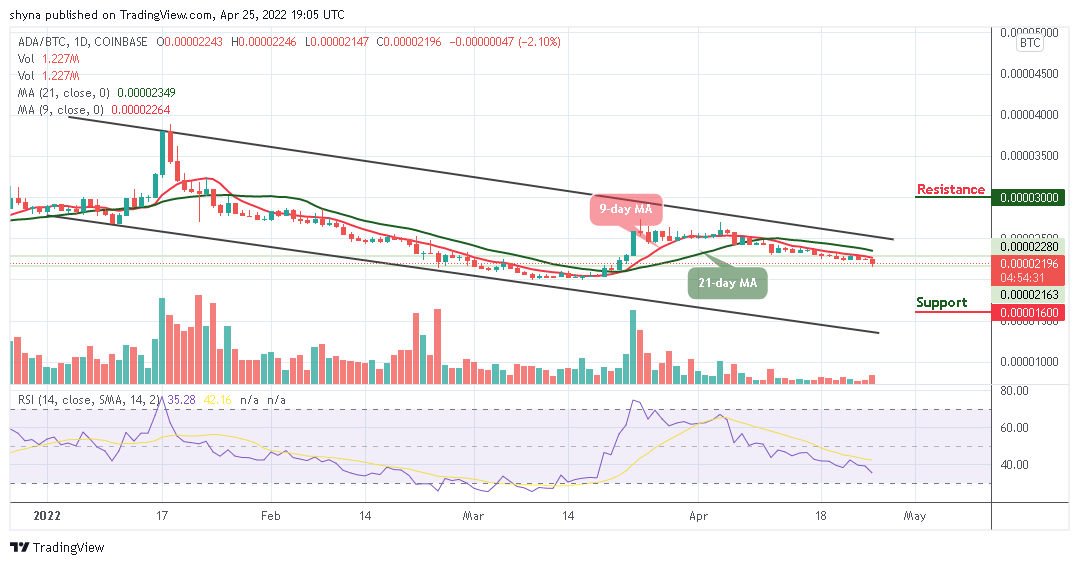 ADABTC – Daily Chart
However, if ADA/BTC crosses above the 9-day and 21-day moving averages, the market is expected to reach the resistance level of 3000 SAT and above. Meanwhile, the technical indicator Relative Strength Index (14) confirms that the market faces the downside as the signal line moves to cross below the lower boundary of the channel.
Delegate Your Voting Power to FEED DRep in Cardano Governance.
DRep ID: drep12ukt4ctzmtf6l5rj76cddgf3dvuy0lfz7uky08jfvgr9ugaapz4 | We are driven to register as a DRep by our deep dedication to the Cardano ecosystem and our aspiration to take an active role in its development, ensuring that its progress stays true to the principles of decentralization, security, and community empowerment.DELEGATE VOTING POWER!