Cardano Price Analysis: ADA/USD Bulls Prepare to Rally Against $1.45
Cardano Price Analysis – August 9 ADA/USD bulls are taking charge of the market as the coin touches the daily high of $1.46. ADA/USD Market Key Levels: Resistance levels: $1.65, $1.75, $1.85 Support levels: $1.30, $1.20, $1.10 The Cardano...
Cardano Price Analysis – August 9
ADA/USD bulls are taking charge of the market as the coin touches the daily high of $1.46.
ADA/USD Market
Key Levels:
Resistance levels: $1.65, $1.75, $1.85
Support levels: $1.30, $1.20, $1.10
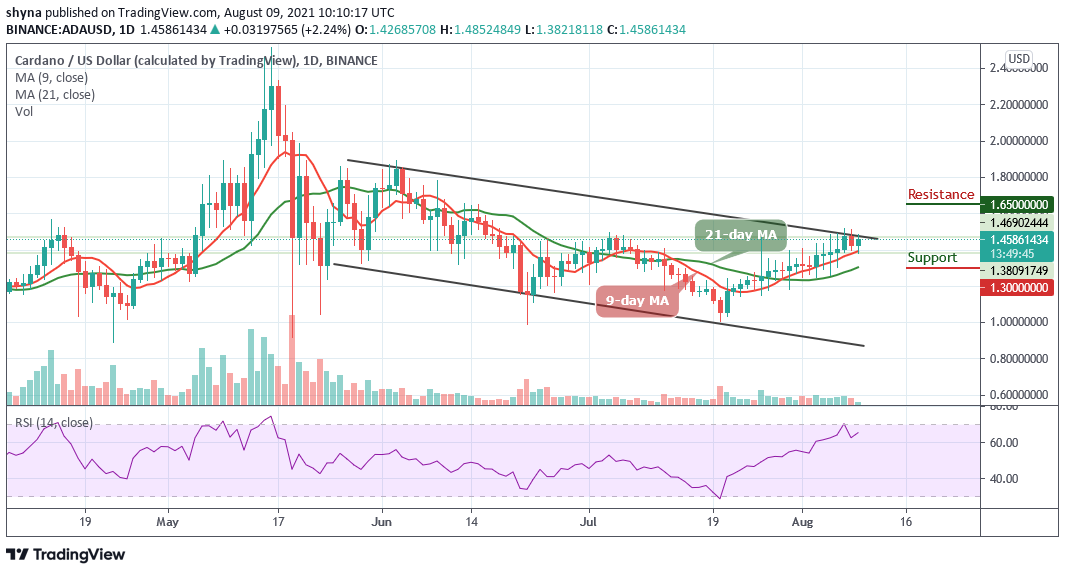
ADAUSD – Daily ChartThe Cardano price has gone from aggressive moves to a relatively stable trend and this change in market behavior could indicate that the ADA price may be reaching new resistance levels, which are essential for future assessment before the next bull run as this could cause the market to cross above the upper boundary of the channel.
Cardano Price Analysis: Cardano (ADA) May Spike Above $1.45
As the daily chart reveals, the Cardano price is noted to be $1.45 and it is recording a gain of over 1.70% in the last 24 hours moving from $1.38 to $1.46. It may move past $1.48 in the next positive movement and may take a few days to start trading above the $1.50 level.
However, the Cardano (ADA) is now following an uptrend as the price continues to move towards the upper boundary of the channel. The bulls may continue to push the price towards the resistance levels of $1.65, $1.75, and $1.85. Meanwhile, the support levels are located at $1.30, $1.20, and $1.10. Meanwhile, the Relative Strength Index (14) is preparing to move above $65-level, suggesting more bullish signals.
ADA/BTC Market: The Price Consolidates Below the Moving Averages
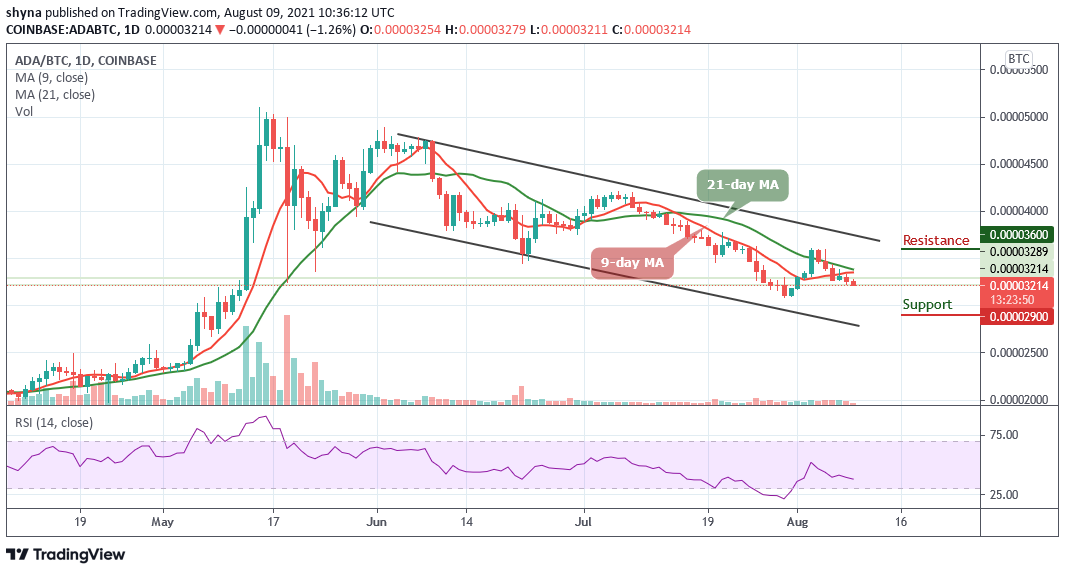
When compares with Bitcoin, the Cardano price keeps moving below the 9-day and 21-day moving averages. Meanwhile, any bullish cross above the 9-day and 21-day moving averages at 3500 SAT could encourage the bulls to extend the rally towards 3600 SAT and $3800 SAT.
 ADABTC – Daily Chart
In other words, a close below the moving averages could reverse the price direction towards the daily support at 3100 SAT, further bearish movement could take the coin to the support of 2900 SAT and below. Meanwhile, there is a possibility that the price may continue the bearish trend as the technical indicator Relative Strength Index (14) is likely to move below 40-level with the signal line pointing to the south.
SNEKbot by DexHunter on CARDANO
Cardano's Telegram Trading Bot live on Cardano mainnet!TRADE NOW!