Cardano Price Analysis: ADA/USD Bulls May Come to Play after Sideways Movement
ADA Price Analysis – April 11 Cardano may lack short-term and medium-term support but if the price rises even further, the coin is likely to face moderate volatility and gain long-term. ADA/USD Market Key Levels: Resistance levels: $1.40, $1.50,...

ADA Price Analysis – April 11
Cardano may lack short-term and medium-term support but if the price rises even further, the coin is likely to face moderate volatility and gain long-term.
ADA/USD Market
Key Levels:
Resistance levels: $1.40, $1.50, $1.60
Support levels: $1.10, $1.00, $0.90
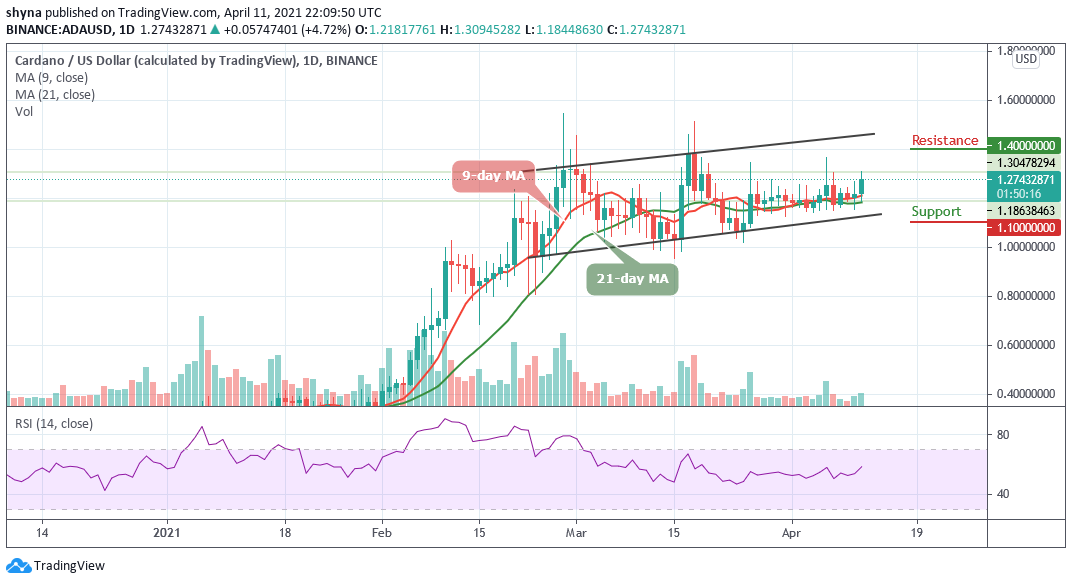 ADAUSD – Daily Chart
ADA/USD is currently trading around $1.27 level above the 9-day and 21-day moving averages. In the range of the ascending channel, the closest support is located at $1.15, with a close resistance at $1.30. Meanwhile, if the market increases, additional resistance can be found above the upper boundary of the channel. Below the moving averages, traders can expect support around $1.12.
What to Expect from Cardano (ADA)
Looking at the daily chart, it is obvious that the market may likely create more bullish trends once the sideways movement fades away and this is actually noticeable for the technical indicator RSI (14) as the signal line is seen moving close to 60-level. Since a few weeks ago, Cardano (ADA) has been moving in the same direction as the market ranges.
Today, the market decides to stay above the resistance level of $1.25 but any bearish movement below this level may lead the coin to a serious downtrend. However, the support levels for ADA/USD are located at $1.10, $1.00, and $0.90, while the resistance levels are found at $1.40, $1.50, and $1.60 respectively.
ADA/BTC Market: Keeps Moving Sideways
When compares with Bitcoin, the support level of this range is built around 1980 SAT. The resistance is set at 2300 SAT because the market price is still changing around the 9-day and 21-day moving averages. Technically, the price continues to move sideways within the channel since March 22 but today, the technical indicator RSI 14 signal line moves bullishly toward the 55-level.
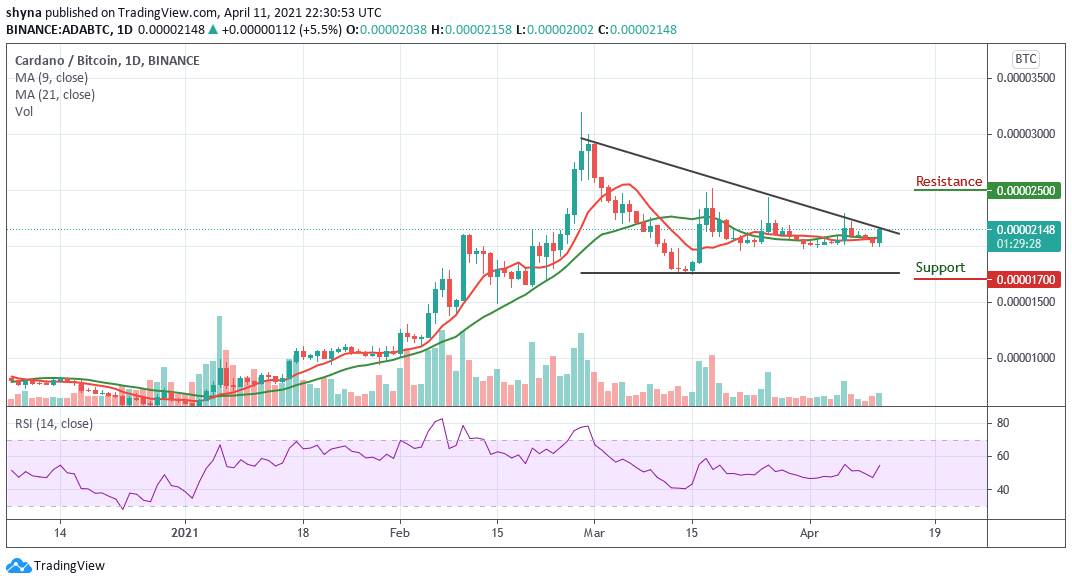 ADABTC – Daily Chart
However, if the ADA price crosses below the moving averages, ADA/BTC may likely create a new low as the coin may hit the support level of 1700 SAT and below. Meanwhile, any bullish movement above the upper boundary of the channel may allow the market to form a new upward trend and this could reach the potential resistance at 2500 SAT and above.
Delegate Your Voting Power to FEED DRep in Cardano Governance.
DRep ID: drep12ukt4ctzmtf6l5rj76cddgf3dvuy0lfz7uky08jfvgr9ugaapz4 | We are driven to register as a DRep by our deep dedication to the Cardano ecosystem and our aspiration to take an active role in its development, ensuring that its progress stays true to the principles of decentralization, security, and community empowerment.DELEGATE VOTING POWER!