Cardano Price Analysis: ADA/USD Breaks Above $3.0 Level
Cardano (ADA) Price Analysis – September 3 Cardano is down by 0.14% after touching the daily high of $3.08 as the next support may come at a $2.7 level. ADA/USD Market Key Levels: Resistance levels: $3.4, $3.5, $3.6 Support...
Cardano (ADA) Price Analysis – September 3
Cardano is down by 0.14% after touching the daily high of $3.08 as the next support may come at a $2.7 level.
ADA/USD Market
Key Levels:
Resistance levels: $3.4, $3.5, $3.6
Support levels: $2.5, $2.4, $2.3
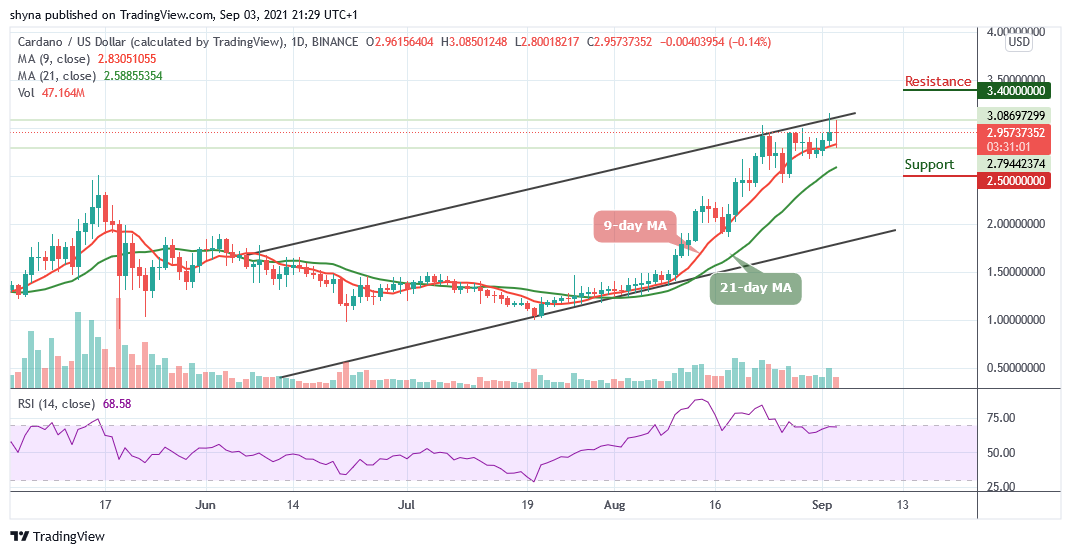
ADAUSD – Daily ChartADA/USD is seen creating a new high as the coin trades above the 9-day and 21-day moving averages. At the time of writing, the entire market is seen dealing with the bullish movement as ADA/USD keeps the movement intact. The same reflects that the coin has pretty good potential and that the ADA price may drop slightly to prepare for an additional uptrend.
Cardano Price Analysis: ADA Rally May Continue
As the Cardano price moves toward the upper boundary of the channel, if the pair begins to stay under the control of bears, the market price may drop to the nearest supports at $2.5, $2.4, and $2.3. Meanwhile, on the upside, bulls need to push the price above the upper boundary of the channel and could move the coin towards the resistance levels of $3.4, $3.5, and $3.6. Meanwhile, the technical indicator Relative Strength Index (14) is now seen moving in the same direction around the overbought region, suggesting a sideways movement.
ADA/BTC Market: Consolidates Above Moving Averages
Against Bitcoin, the market is seen to be moving above the 9-day moving average following the ascending channel where the price is expected to break above the upper boundary of the channel. Meanwhile, should the price cross below the 9-day and 21-day moving averages, the market may begin a downward movement which could touch the nearest support at 5300 SAT and below.
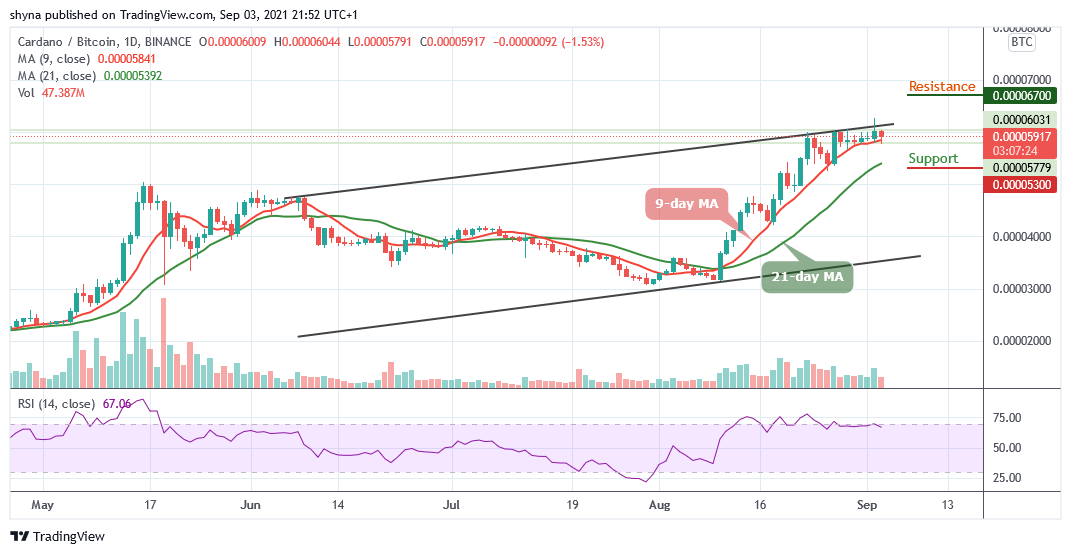 ADABTC – Daily Chart
On the contrary, if bulls push the market to the north and above the upper boundary of the channel, they may take the price to the upside which could cause the market to reach the resistance level of 6700 SAT and above. Meanwhile, the technical indicator Resistance Strength Index (14) is seen moving in the same direction around 70-level, suggesting a sideways movement.
SNEKbot by DexHunter on CARDANO
Cardano's Telegram Trading Bot live on Cardano mainnet!TRADE NOW!