Cardano Price Analysis: ADA/USD Breaks Above $1.25; Price Begins a Journey to New All-Time Highs
ADA Price Analysis – March 17 After trading above the moving averages, the Cardano price continues to rise as the coin touches the daily high at $1.34. ADA/USD Market Key Levels: Resistance levels: $1.48, $1.50, $1.52 Support levels: $1.0,...

ADA Price Analysis – March 17
After trading above the moving averages, the Cardano price continues to rise as the coin touches the daily high at $1.34.
ADA/USD Market
Key Levels:
Resistance levels: $1.48, $1.50, $1.52
Support levels: $1.0, $0.98, $0.96
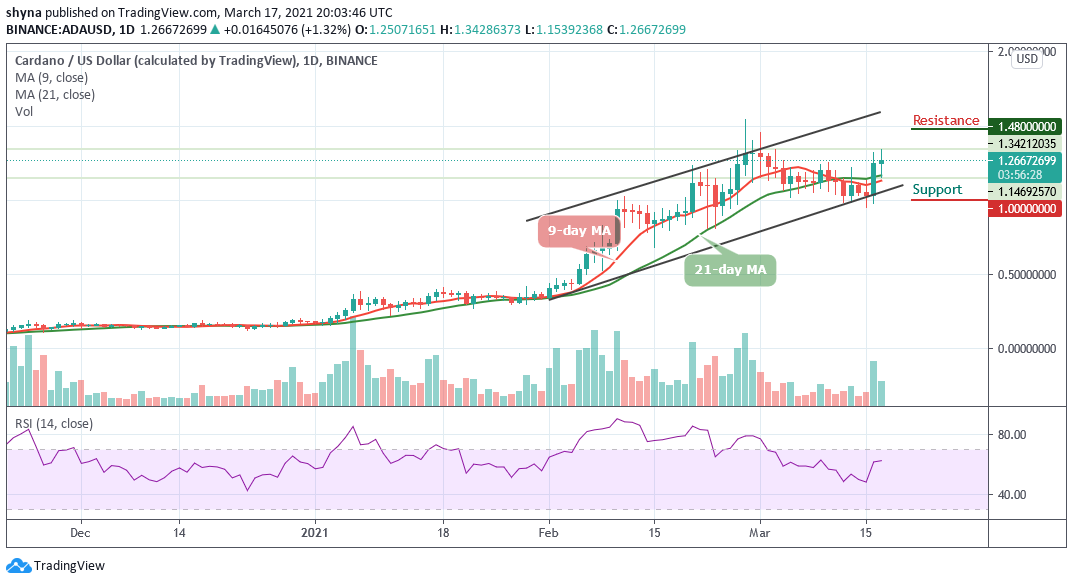 ADAUSD – Daily Chart
ADA/USD is currently trading at $1.25 after confirming a daily uptrend and climbing above the 9-day and 21-day moving averages. In case the buyers were able to push the price above the resistance level of $1.35 and the daily candlestick close above this level, then, the price may rally towards the previous high, resistance level of $1.40.
Would Cardano Go Up or Down?
According to the daily chart, the 9-day MA is currently below the 21-day MA and the coin is likewise trading around the resistance level of $1.26 which connotes that the market may likely follow the sideways movement as the technical indicator implies. Meanwhile, the RSI (14) is currently moving in the same direction above the 60-level.
However, should in case the buyers keep the price above the moving averages at the resistance level of $1.30 and the daily candlestick close above this level, then, the price may rally towards the resistance levels of $1.48, $1.50, and $1.52 while the supports could be found at $1.0, $0.98, and $0.96.
ADA/BTC Market: Consolidating Within the Moving Averages
Against Bitcoin, if the market follows a bullish surge, ADA may swing to the resistance level of 2800 SAT and above. Crossing below the 9-day moving average lies the support levels at 1700 BTC and below.
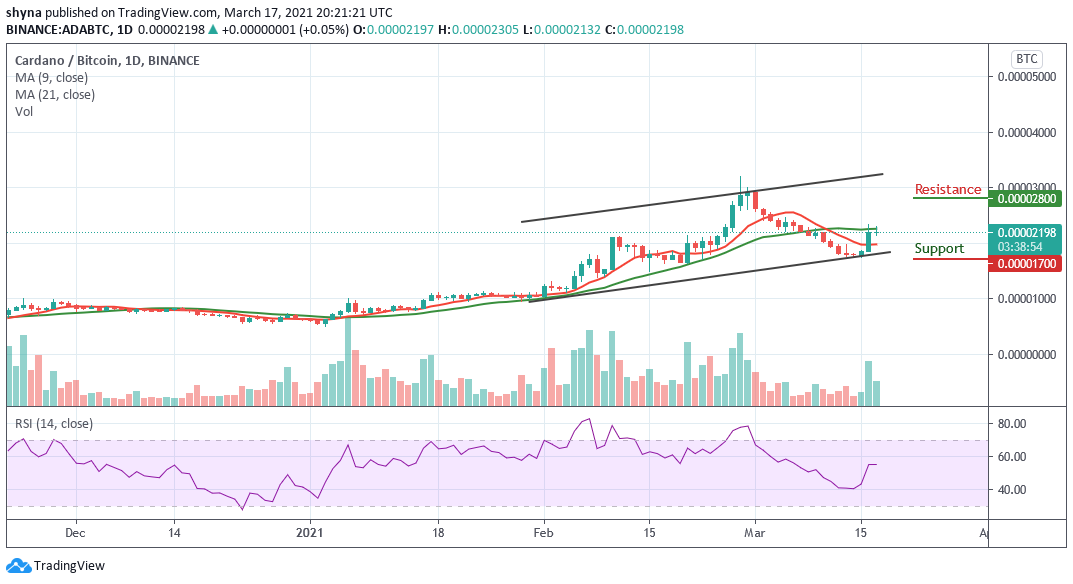 ADABTC – Daily Chart
Looking at the technical indicator RSI (14), the coin is currently moving around the 55-level, which may likely cause the market to start moving sideways. Meanwhile, as the 9-day MA remains below the 21-day MA, ADA/BTC may continue to trade on the negative sides.
Delegate Your Voting Power to FEED DRep in Cardano Governance.
DRep ID: drep12ukt4ctzmtf6l5rj76cddgf3dvuy0lfz7uky08jfvgr9ugaapz4 | We are driven to register as a DRep by our deep dedication to the Cardano ecosystem and our aspiration to take an active role in its development, ensuring that its progress stays true to the principles of decentralization, security, and community empowerment.DELEGATE VOTING POWER!