Cardano price analysis: ADA forms sideways pattern above $0.38 support level
The post Cardano price analysis: ADA forms sideways pattern above $0.38 support level appeared on BitcoinEthereumNews.com. Cardano price analysis is neither bullish nor bearish for today, as price can be seen falling into a sideways pattern around the $0.40...

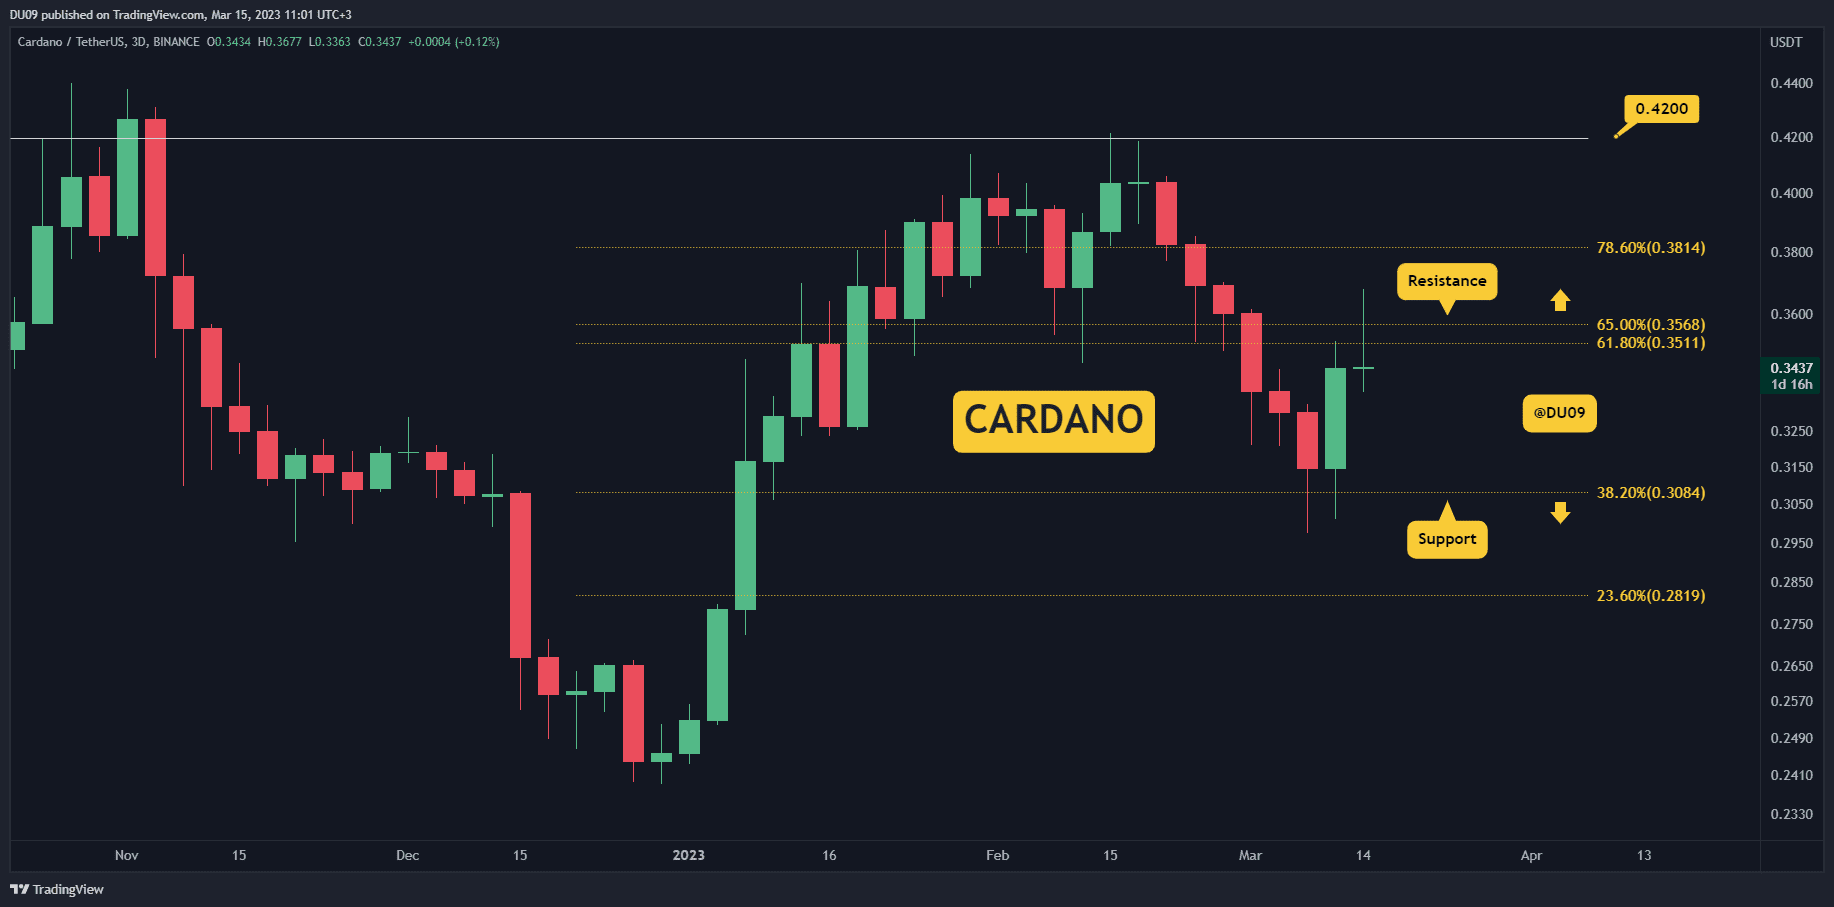
Cardano price analysis is neither bullish nor bearish for today, as price can be seen falling into a sideways pattern around the $0.40 mark. It could be argued that ADA bulls will be gaining momentum for the next move upward, and an immediate test of the $0.42 resistance could follow, however a decline down to $0.38 support could trigger further loss of market interest. The current support region has provided a crucial region previously in May 2018 and January 2021. Both instances provided a breakout for ADA price and bulls will be looking to pivot around this point to target the immediate resistance at $0.42.
The larger cryptocurrency market showed mixed signals over the past 24 hours, as Bitcoin trended sideways similar to Cardano, around the $20,500 mark. Ethereum dropped 1 percent to move down to $1,600, whereas major Altcoins showed consistent uptrends across the board. Ripple gained 1 percent to move as high as $0.46, while Dogecoin surged upwards once again to move up to $0.12. Meanwhile, Solana and Polkadot reached $32.68 and $6.65, respectively, recording minor increments each.
 Cardano price analysis: Cryptocurrency heat map. Source: Coin360
Cardano price analysis: ADA remains above crucial moving averages as price reaches bottom
On the 24-hour candlestick chart for Cardano price analysis, price can be seen forming a bottom around the $0.40 mark with support set at $0.38. Trading volume has also been decreasing over the past 24 hours, which presents a weak sign for ADA bulls. However, price could yet test the $0.42 resistance as the 24-hour relative strength index (RSI) shows positive momentum at 53.85. Alternatively, a fall below the $0.35 mark could invalidate the bullish outlook for ADA.
 Cardano price analysis: 24-hour chart. Source: Trading View
Price still sits above the crucial 9 and 21-day moving averages, and the 50-day exponential moving average (EMA) at $0.39. The daily moving average convergence divergence (MACD) is still bullish, but could soon be forming a lower high that could indicate a possible reversal if the trend continues. All in all, Cardano price seems to currently have been stuck within the $0.38 and $0.42 price range and a clear out from this range could attract new volume and expand further. A permanent move above the $0.42 resistance could still realise the bullish target for $0.5 in November.
Disclaimer. The information provided is not trading advice. Cryptopolitan.com holds no liability for any investments made based on the information provided on this page. We strongly recommend independent research and/or consultation with a qualified professional before making any investment decisions.
Source: https://www.cryptopolitan.com/cardano-price-analysis-2022-10-31/
Post navigation
Delegate Your Voting Power to FEED DRep in Cardano Governance.
DRep ID: drep12ukt4ctzmtf6l5rj76cddgf3dvuy0lfz7uky08jfvgr9ugaapz4 | We are driven to register as a DRep by our deep dedication to the Cardano ecosystem and our aspiration to take an active role in its development, ensuring that its progress stays true to the principles of decentralization, security, and community empowerment.DELEGATE VOTING POWER!