Cardano price analysis: Bullish lead takes ADA to $0.3423 as the market continues to surge – Cryptopolitan
Cardano price analysis shows an uptrend as the ADA/USD pair holds above $0.3400. The bullish trend has been in place since the start of this week, and the pair has climbed from $0.3200 to a high of $0.3566. The ADA/USD pair is currently trading at $0.3423, up 1.74% for the day as of the time …<p class="read-more"> <a class="" href="https://www.cryptopolitan.com/cardano-price-analysis-2023-03-18/"> <span class="screen-reader-text">Cardano price analysis: Bullish lead takes ADA to $0.3423 as the market continues to surge</span> Read More »</a></p>

Cardano price analysis shows an uptrend as the ADA/USD pair holds above $0.3400. The bullish trend has been in place since the start of this week, and the pair has climbed from $0.3200 to a high of $0.3566. The ADA/USD pair is currently trading at $0.3423, up 1.74% for the day as of the time of writing. The ADA/USD pair has been trading in a range between $0.3344 and $0.3566 over the past few days, with more upside potential as the bulls target $0.3600 in the near term.
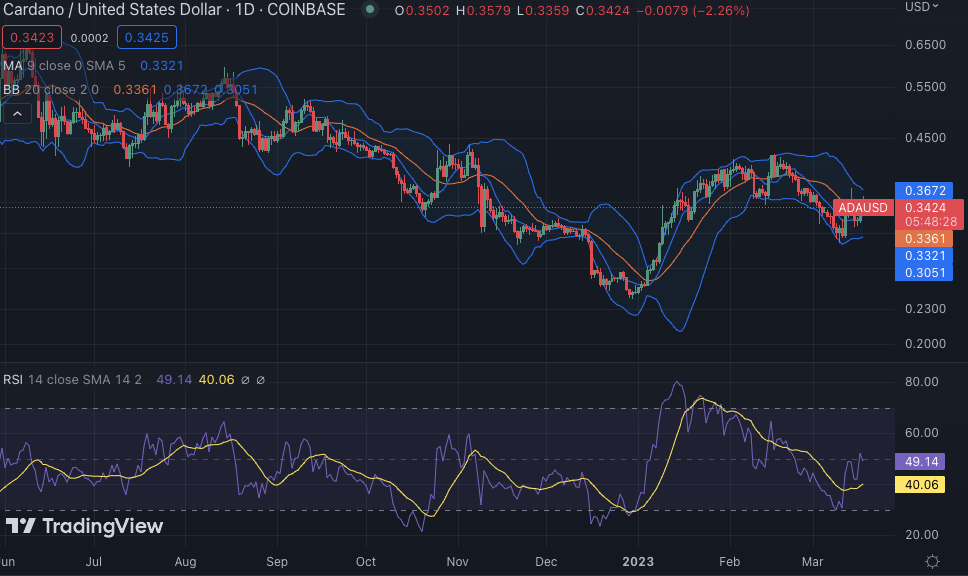
Cardano price analysis 24-hour chart: Strong surge takes ADA to $0.3423
The 24-hour price chart for Cardano price analysis shows that the present bullish momentum has yielded good results as the pair has gained more than 1.06 percent in value since the start of this week. The support for the ADA/USD pair is present at $0.3344, which may act as a cushion if the bulls fail to sustain the current trend. The resistance is seen at $0.3566, which may act as a hurdle for further gains in the ADA/USD pair.

The moving average (MA) indicator, which is currently $0.3321, is still higher than the SMA 50 curve. The volatility in the one-day price chart is comparatively high, with the upper Bollinger band at $0.3672 high while the lower Bollinger band at $0.3051. The Relative Strength Index (RSI) score after today’s improvement has reached index 49.14 and will continue to improve further if the buying activity continues in the market.
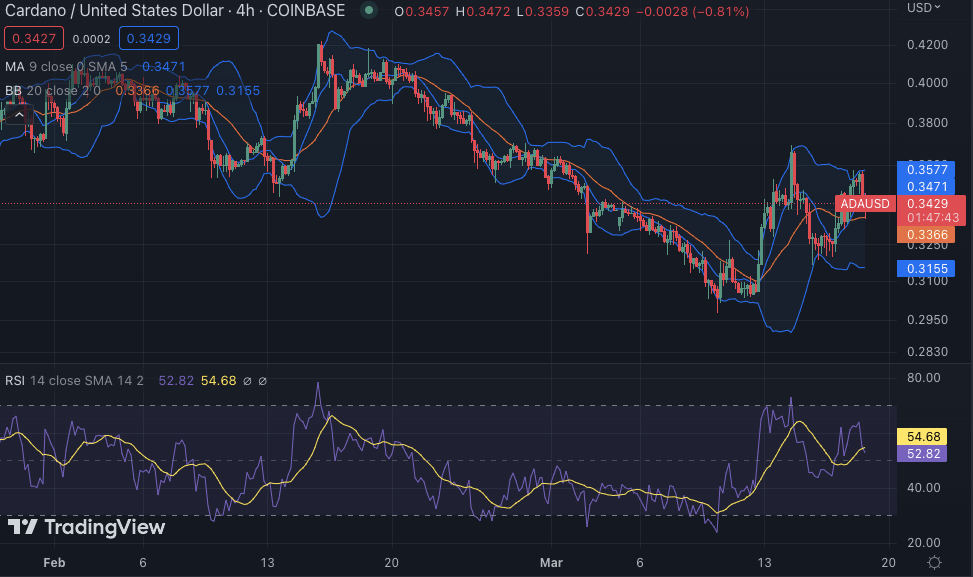
Cardano price analysis 4-hour chart: Recent updates
On the 4-hour chart, Cardano price analysis shows that prices have taken out all the key levels to the upside with ease as the market looks to be in a bullish run. The price is expected to continue to rise as the market looks to be in a bullish trend. ADA/USD indicates that the buyers are currently in control of the market as they look to push prices toward the $0.3600 level in the short term.

The Moving Average (MA) indicator has also risen to $0.3471, which is well above the SMA 50 line and shows that buyers are in control of the market. The volatility is also high, with the upper Bollinger band at $0.3577, which might be a barrier to further gains in the market, while the lower Bollinger band is at $0.3155. The Relative Strength Index (RSI) is also showing an improvement in the market as it has reached index 52.82, which indicates that buyers are in control of the market and will continue to push prices higher in the coming days.
Cardano price analysis conclusion
The price experienced bullish progression today, as confirmed by the one-day and four-hour Cardano price analysis. The bulls are now back on track as they have been able to bring the price up to $0.3423 in the last 24 hours as the trend remained bullish throughout the day. It can be expected that Cryptocurrencies will continue their bullish ascent in the coming hours.
Disclaimer. The information provided is not trading advice. Cryptopolitan.com holds no liability for any investments made based on the information provided on this page. We strongly recommend independent research and/or consultation with a qualified professional before making any investment decisions.
Delegate Your Voting Power to FEED DRep in Cardano Governance.
DRep ID: drep12ukt4ctzmtf6l5rj76cddgf3dvuy0lfz7uky08jfvgr9ugaapz4 | We are driven to register as a DRep by our deep dedication to the Cardano ecosystem and our aspiration to take an active role in its development, ensuring that its progress stays true to the principles of decentralization, security, and community empowerment.DELEGATE VOTING POWER!


