Cardano, Elrond, Neo Price Analysis: 10 February
The post Cardano, Elrond, Neo Price Analysis: 10 February appeared on BitcoinEthereumNews.com. Cardano saw a golden cross as its 4-hour 20 SMA moved above the 50-200 SMA while continuing the up-channel oscillation. On the other hand, Elrond and Neo...

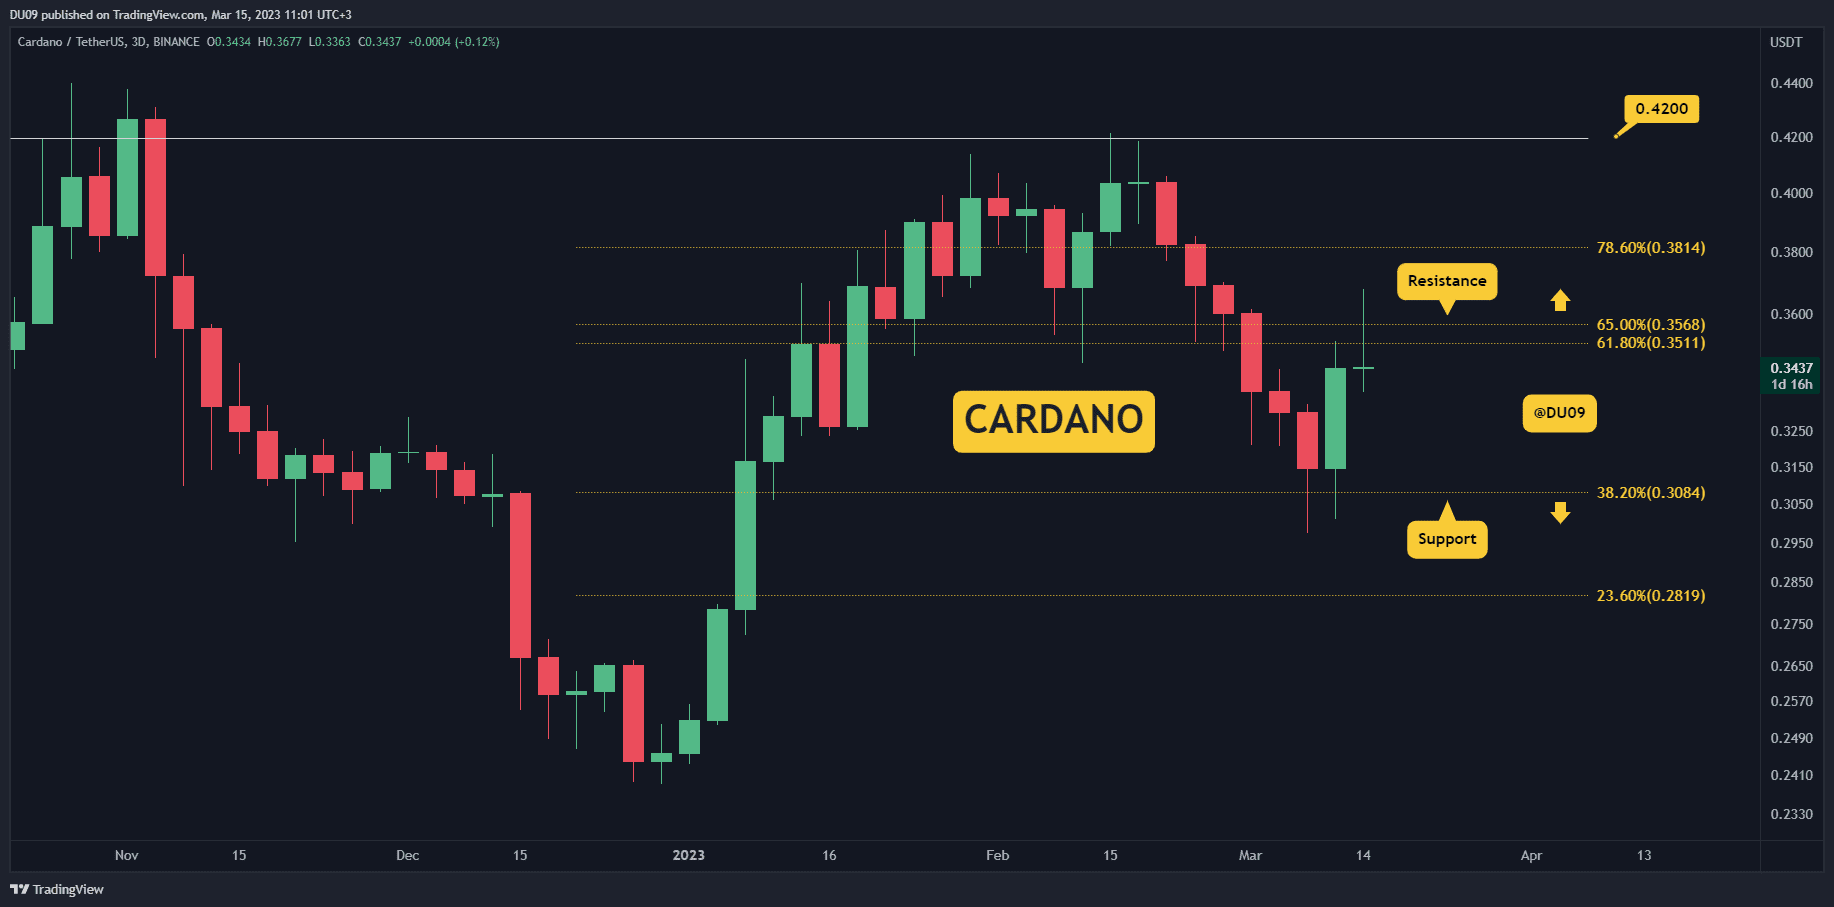
Cardano saw a golden cross as its 4-hour 20 SMA moved above the 50-200 SMA while continuing the up-channel oscillation. On the other hand, Elrond and Neo saw solid ascending channel gains over the past two weeks but now formed a bearish divergence with its RSI as they braced for a near-term setback.
Cardano (ADA)

Source: TradingView, ADA/USDT
The alt fell by 44.2% (from 18 January) and poked its nine-month low on 22 January. However, ADA saw a 32.2% recovery as it pierced through the $1.12, $1.2-mark. Since then, the half-line of the up-channel (white, dashed) has assumed strong support.
It is vital to note that the 20 SMA (red) jumped above the 50/200 SMA on 9 February, affirming a bullish edge. Now, the immediate resistance stood near $1.2, followed by the upper trendline of the up-channel (white).
At press time, ADA traded at $1.176. Over the past two days, it saw a substantial decrease in buying pressure as the RSI drifted from the overbought region toward the half-line. But the bulls seemed to uphold the midline support. Any close below this level would propel a fall toward the $1.12-level.
Elrond (EGLD)

Source: TradingView, EGLD/USDT
Since striking its ATH on 23 November near the $544-mark, EGLD steeply declined, as evidenced by the bearish trendline (yellow) on its 4-hour chart.
After the recent sell-off, the bulls stepped in at the $118.2-mark and upheld the six-month-long support. As a result, the recovery phase saw an impressive 76.9% rally (from its five-month low on 22 January) that poked above the $185-mark. During this phase, it also breached its 11-week trendline (previous resistance, yellow).
At press time, ELGD was trading at $183.9. The RSI correlated the price action while heading into the overbought region on 7 February. Since then, it formed a bearish divergence (yellow) with price as it headed to test the 60-mark support. Besides, the Squeeze Momentum Indicator now flashed black dots, hinting at a low volatility phase.
NEO

Source: TradingView, NEO/USDT
After poking its 3-month high on 6 September, NEO has witnessed multiple sell-offs while losing crucial price points. The most recent sell-off noted a 37% retracement (from 19 January) as the alt hit its one-year low on 24 January.
While the bulls defended the $16.4-level, NEO registered a nearly 58% ROI since then as it challenged the $24-mark resistance. The immediate support stood near the midline of the up-channel.
At press time, NEO traded 87.5% below its ATH at $24.78. The RSI stood in the overbought territory while forming a bearish divergence with the price. A reversal from this level to test the 56-mark would be likely.
Source: https://ambcrypto.com/cardano-elrond-neo-price-analysis-10-february/
Post navigation
Delegate Your Voting Power to FEED DRep in Cardano Governance.
DRep ID: drep12ukt4ctzmtf6l5rj76cddgf3dvuy0lfz7uky08jfvgr9ugaapz4 | We are driven to register as a DRep by our deep dedication to the Cardano ecosystem and our aspiration to take an active role in its development, ensuring that its progress stays true to the principles of decentralization, security, and community empowerment.DELEGATE VOTING POWER!


