Cardano-Based DeFi ADALend Added to “Essential Cardano List” by IOHK
ADALend listed by IOHK among most crucial products for Cardano decentralized applications ecosystem ADALend, one of the pioneering cryptocurrency lending/borrowing instruments of Cardano’s ecosystem, has accomplished a major milestone. ADALend DeFi added to IOHK’s list of essential products for Cardano According to...

Cardano
Published
10 hours ago
on
19/10/2021

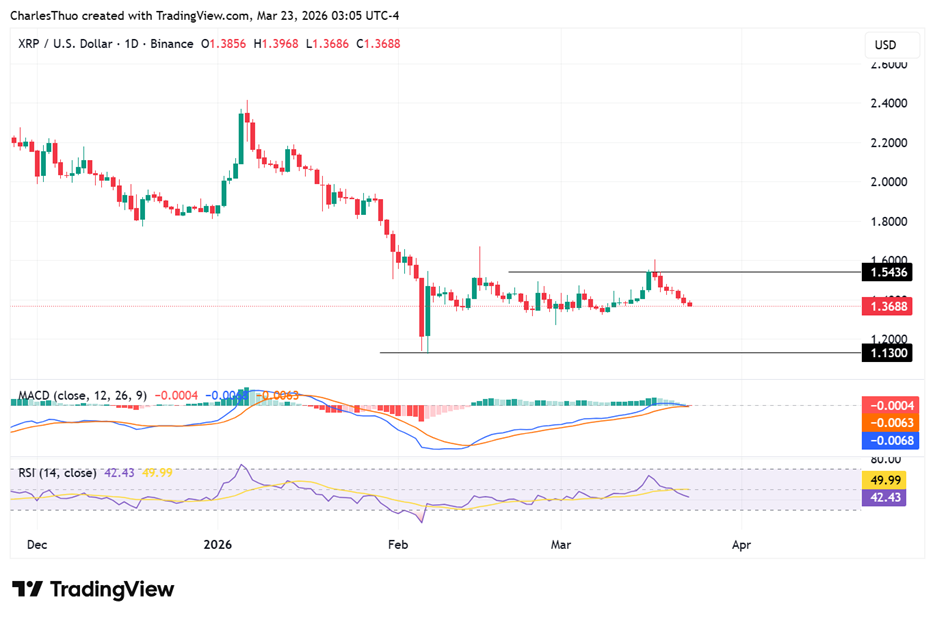
Cardano [ADA], ranked today at 4th place in the crypto market, reached a high of $2.157, followed by a low price of $2.118. The market volatility has decreased as the price resistance can be seen at $2.175, which currently remains untethered. The nearest support at $2.115 holds.
Furthermore, the data from Coinmarketcap shows that the trading volume for the past 24 hours had surged by 26.21%, indicating that the buyers are taking advantage of the short-term bearish trend.
Price movement in recent days
The price action for Cardano in the recent period has been hovering between $2-$2.3, indicating low volatility. The price of ADA/USDT rose by 109.73% in the month of August, whereas it fell by 26.21% in the month of September.
Furthermore, the highest price in the last 30 days was $2.46, while the lowest was $1.92. The coin’s highest price remains at $3.1, achieved two months ago.
Cardano price analysis on the basis of technical indicators
The technical indicators on the 1-day chart indicated that the price of the token was progressing towards the lower end of the Bollinger Bands. This means that increased volatility will follow in the short term, and if the support at $2.115 breaks, we might see a breakout from the lower end.
Furthermore, the Cardano price analysis reveals that the current movement is turning bearish as the price action dropped below the 50-day Moving Average.
 Cardano price analysis on the chart by TradingView
The RSI indicator on the 1-day chart represents a value below 50 while the gradient is negative. The negative gradient suggests that the selling pressure is increasing.
The MACD indicator currently shows that the histogram is green, but the intensity has decreased, and a bearish crossover might take place in the 1-day chart below.
 Cardano price analysis on the chart by TradingView
Cardano price analysis: Conclusion
Cardano price analysis can be concluded on a bearish note for today, although the price of Bitcoin currently holds strong above $62k. With the news surrounding the approval of Valkyrie Bitcoin futures ETF, the possibilities for new all-time highs for Bitcoin remain strong.
Cardano, a smart contracts platform, has been involved with a lot of projects and is even getting into the NFT industry as well. We can expect higher volatility in the short term.
Delegate Your Voting Power to FEED DRep in Cardano Governance.
DRep ID: drep12ukt4ctzmtf6l5rj76cddgf3dvuy0lfz7uky08jfvgr9ugaapz4 | We are driven to register as a DRep by our deep dedication to the Cardano ecosystem and our aspiration to take an active role in its development, ensuring that its progress stays true to the principles of decentralization, security, and community empowerment.DELEGATE VOTING POWER!