Cardano (ADA) Price Analysis: Breakout Zone Near $0.90
The post Cardano (ADA) Price Analysis: Breakout Zone Near $0.90 appeared on BitcoinEthereumNews.com. ADA price started a steady decline from the $1.00 resistance against the US Dollar. The price is now trading below $0.90 and the 55 simple moving...

- ADA price started a steady decline from the $1.00 resistance against the US Dollar.
- The price is now trading below $0.90 and the 55 simple moving average (4-hours).
- There is a major bearish trend line forming with resistance near $0.900 on the 4-hours chart (data feed via Bitfinex).
- The price could continue to move down if it fails to recover above the $0.900 resistance zone.
Cardano price is declining below $0.90 against the US Dollar, similar to bitcoin. ADA price could start a steady increase if it clears $0.90 and $0.918.
Cardano Price Analysis
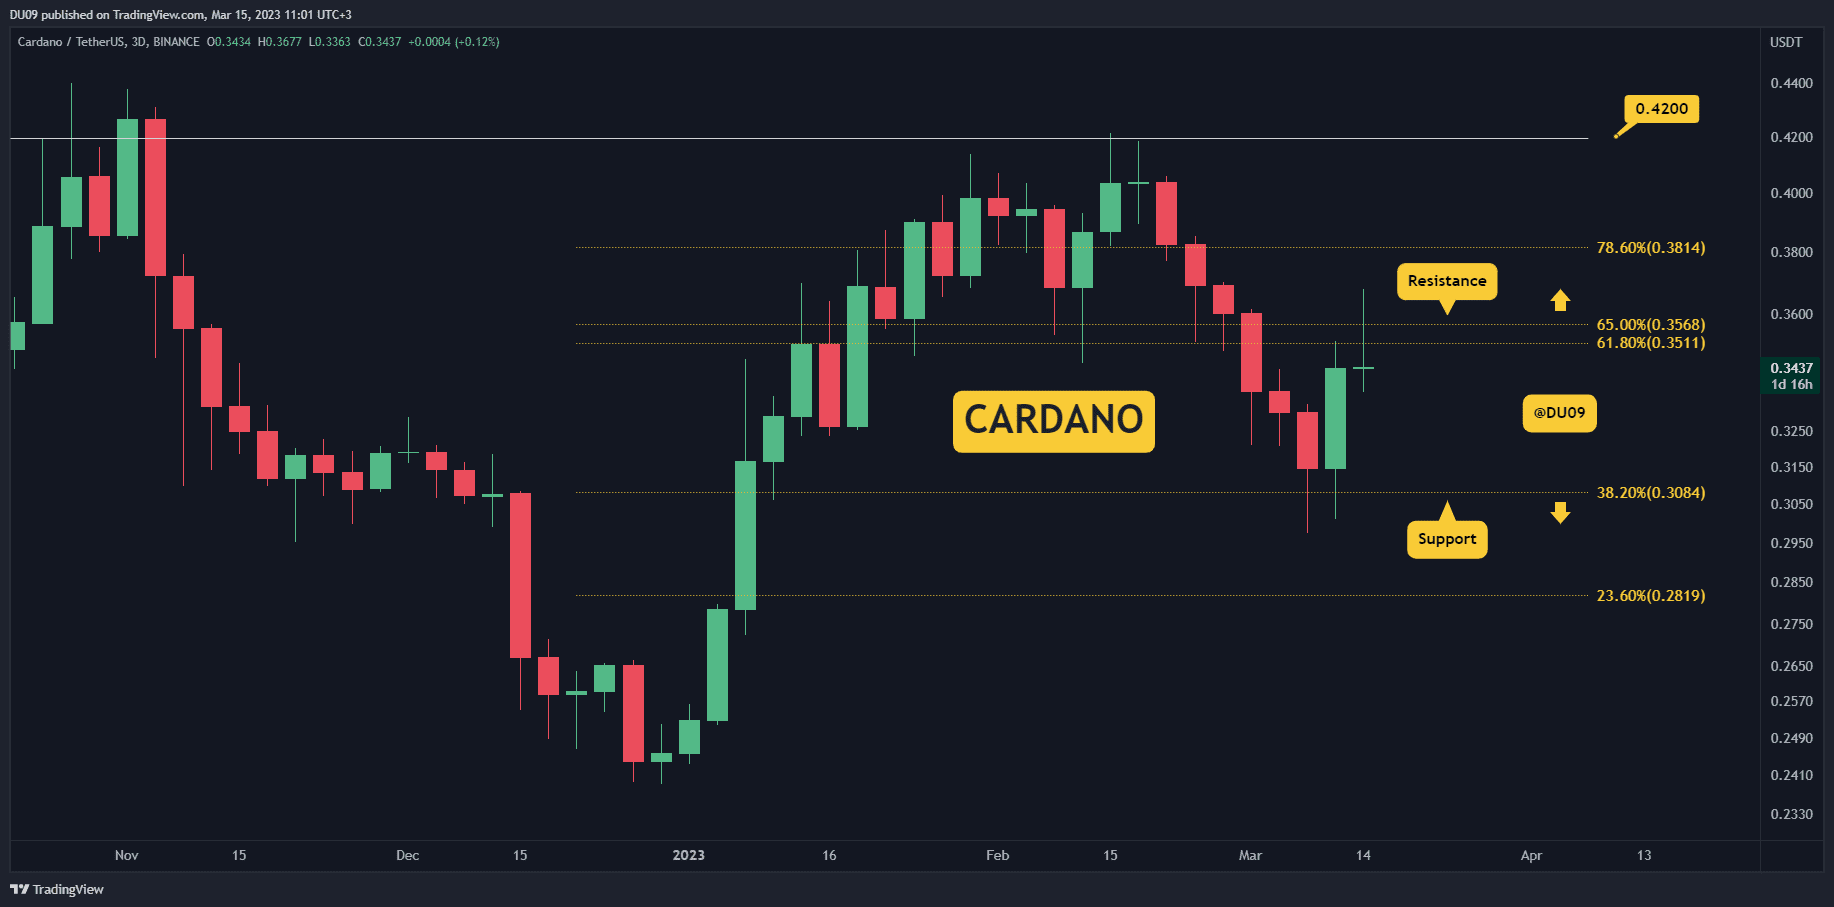
This week, cardano price saw a fresh decline from the $1.00 resistance zone against the US Dollar. The ADA/USD pair traded below the $0.92 and $0.90 support levels to move into a bearish zone.
The price even settled below $0.90 and the 55 simple moving average (4-hours). It even spiked below the $0.850 level and traded as low as 0.827. The price is now correcting losses and trading above the $0.850 level. There was a move above the 23.6% Fib retracement level of the recent decline from the $0.975 swing high to $0.827 low.
On the upside, an immediate resistance is near the $0.90 level. There is also a major bearish trend line forming with resistance near $0.900 on the 4-hours chart.
The trend line is near the 50% Fib retracement level of the recent decline from the $0.975 swing high to $0.827 low. The next key resistance might be near the $0.918 level and the 55 simple moving average (4-hours). A clear upside break above the $0.918 level might send the price towards the $1.00 resistance.
The next key resistance might be near the $1.10 level. Any more gains could start a steady increase towards the $1.15 level in the near term.
On the downside, an immediate support is near the $0.865 level. The next major support is near the $0.850 level. If there are additional losses, the price may perhaps decline towards the $0.78 support level. A break below $0.78 could push the price towards the $0.75 level.
Cardano (ADA) Price
The chart indicates that ADA price is now trading below $0.90 and the 55 simple moving average (4-hours). Overall, the price could continue to move down if it fails to recover above the $0.900 resistance zone.
Technical Indicators
4 hours MACD – The MACD for ADA/USD is now losing pace in the bullish zone.
4 hours RSI – The RSI for ADA/USD is now above the 50 level.
Key Support Levels – $0.865 and $0.850.
Key Resistance Levels – $0.90 and $0.918.
Source: https://www.livebitcoinnews.com/cardano-ada-price-analysis-breakout-zone-near-0-90/
Post navigation
Delegate Your Voting Power to FEED DRep in Cardano Governance.
DRep ID: drep12ukt4ctzmtf6l5rj76cddgf3dvuy0lfz7uky08jfvgr9ugaapz4 | We are driven to register as a DRep by our deep dedication to the Cardano ecosystem and our aspiration to take an active role in its development, ensuring that its progress stays true to the principles of decentralization, security, and community empowerment.DELEGATE VOTING POWER!