BABB crypto gains 32% in 24 hours: Is another 43% rally coming? – Crypto News Aggregator
BABB crypto had a strongly bullish structure at press time. The range breakout has been successful, and the long-term downtrend was broken. Babb [BAX] is a $7 million market cap token that has gained 32.84%...
- BABB crypto had a strongly bullish structure at press time.
- The range breakout has been successful, and the long-term downtrend was broken.
Babb [BAX] is a $7 million market cap token that has gained 32.84% in the past 24 hours. Its trading volume has increased fivefold compared to the previous day, but was still at the very small figure of $409.8k.
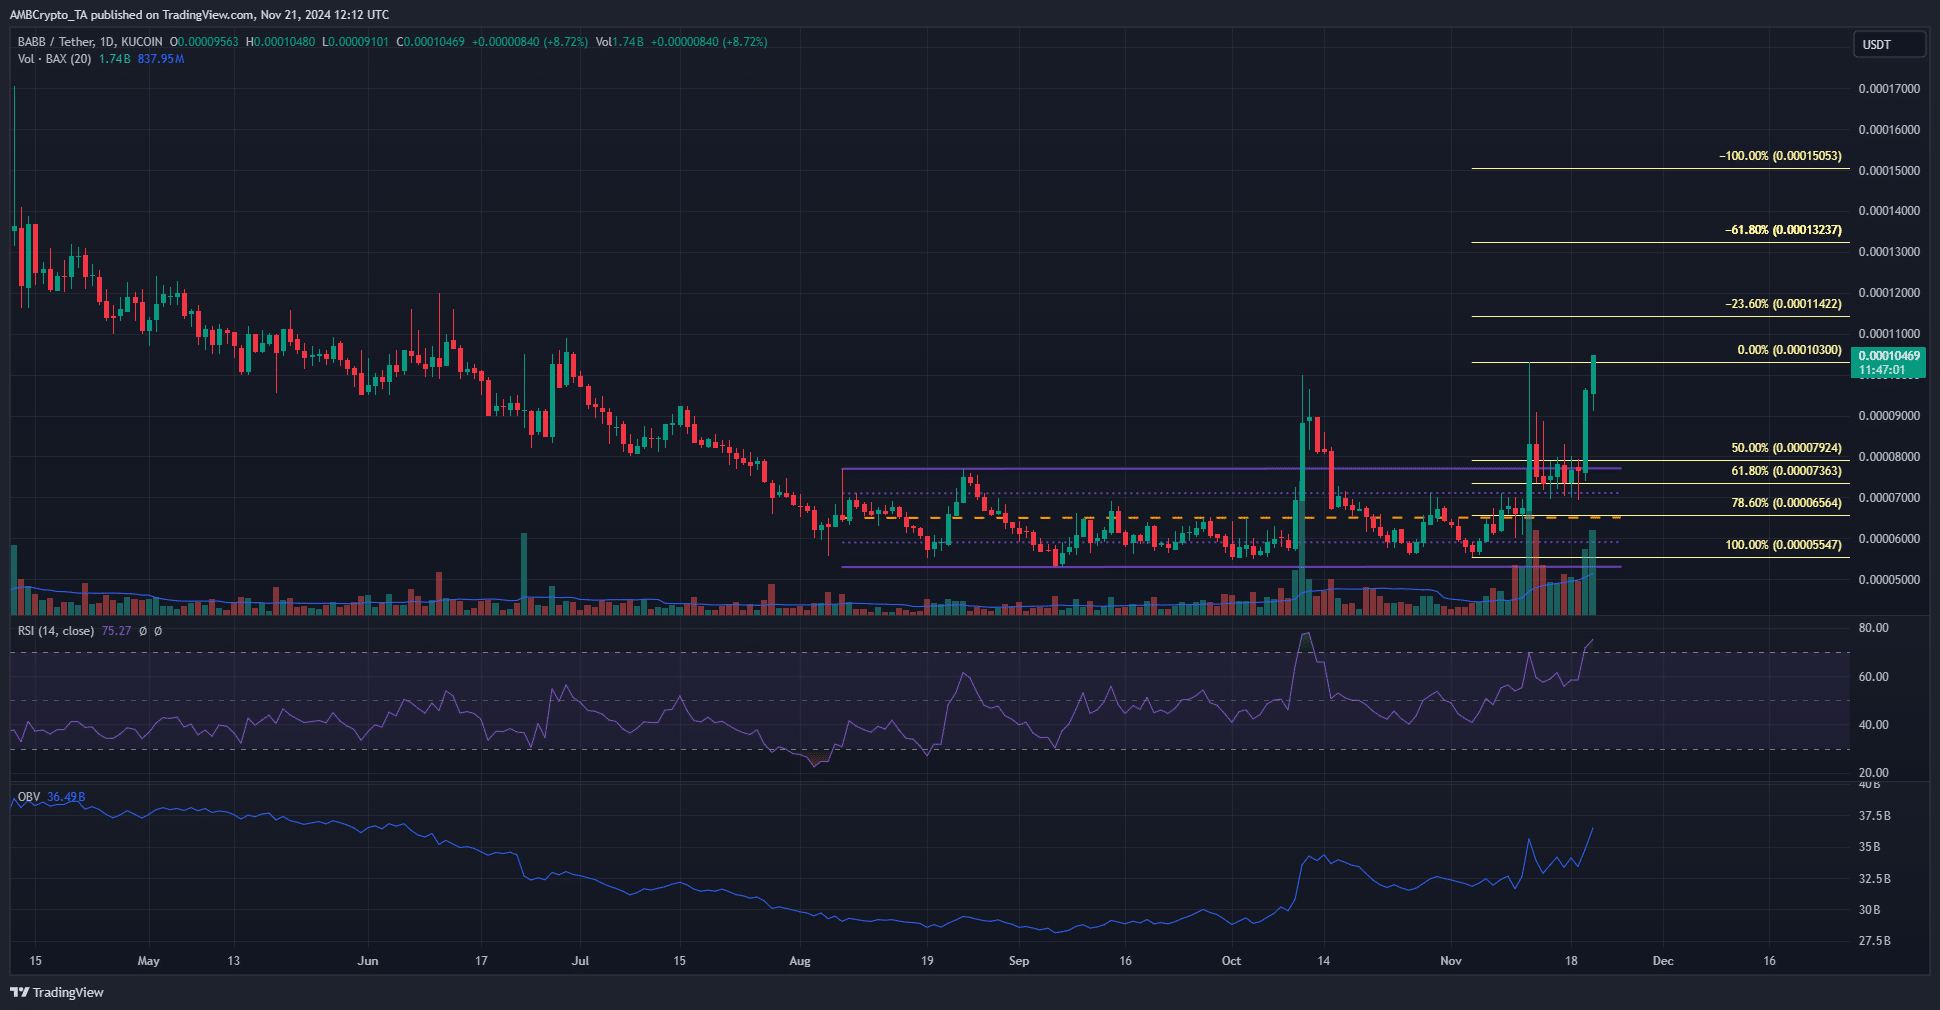
The Fibonacci extension levels showed that BABB crypto is poised to make another 43% move in the coming days. Will the token see increased, sustained demand, or has the hype already begun to die down?
BAX bulls target $0.00015 next
BABB crypto had been in a downtrend from late March to early September.
This downtrend began after the bullish market structure was broken when prices fell below the $0.000175 level, and the bears have been dominant ever since.
Their hegemony has been unraveling since October. The downtrend was followed by a range formation that extended from $0.0000533 to $0.0000776.
In the second week of October, BAX saw a strong rally from the $0.0000568 to $0.0001 level, but the psychological round number resistance rebuffed the buyers.
This breakout failed as the bulls were unable to flip the range highs to support, but another attempt was brewing toward the end of the month.
The strong bullish impetus across the crypto market due to the rapid Bitcoin [BTC] gains gave altcoins a chance to push higher.
Even though BAX was a small-cap coin, it has gained close to 89% since the lows made on Monday the 4th of November. BABB crypto succeeded in flipping the $0.000073 zone from resistance to support.
The bulls have made another rally from this demand zone, taking prices to $0.000104 at press time.
Is your portfolio green? Check the Babb Profit Calculator
The OBV was in an uptrend over the past month. The series of higher lows and higher highs were a sign of steady demand, especially in the past two weeks.
The RSI on the 4-hour chart was at 75 to signal strong bullish momentum but did not show a bearish divergence yet.
Disclaimer: The information presented does not constitute financial, investment, trading, or other types of advice and is solely the writer’s opinion.
Post navigation
Delegate Your Voting Power to FEED DRep in Cardano Governance.
DRep ID: drep12ukt4ctzmtf6l5rj76cddgf3dvuy0lfz7uky08jfvgr9ugaapz4 | We are driven to register as a DRep by our deep dedication to the Cardano ecosystem and our aspiration to take an active role in its development, ensuring that its progress stays true to the principles of decentralization, security, and community empowerment.DELEGATE VOTING POWER!


