Cardano price analysis:- The price is near the colossal demand zone, and the bears are winning. Will they break it, or bulls are going to interfere?
The trading volume of ADA Coin in the last 24hr at the time of writing this article is -24% The price of ADA/BTC and ADA/ETH at the time of writing this article is 0.00002671 BTC and 0.0003273 ETH, respectively....

- The trading volume of ADA Coin in the last 24hr at the time of writing this article is -24%
- The price of ADA/BTC and ADA/ETH at the time of writing this article is 0.00002671 BTC and 0.0003273 ETH, respectively.
- The 20MA is acting as a resistance
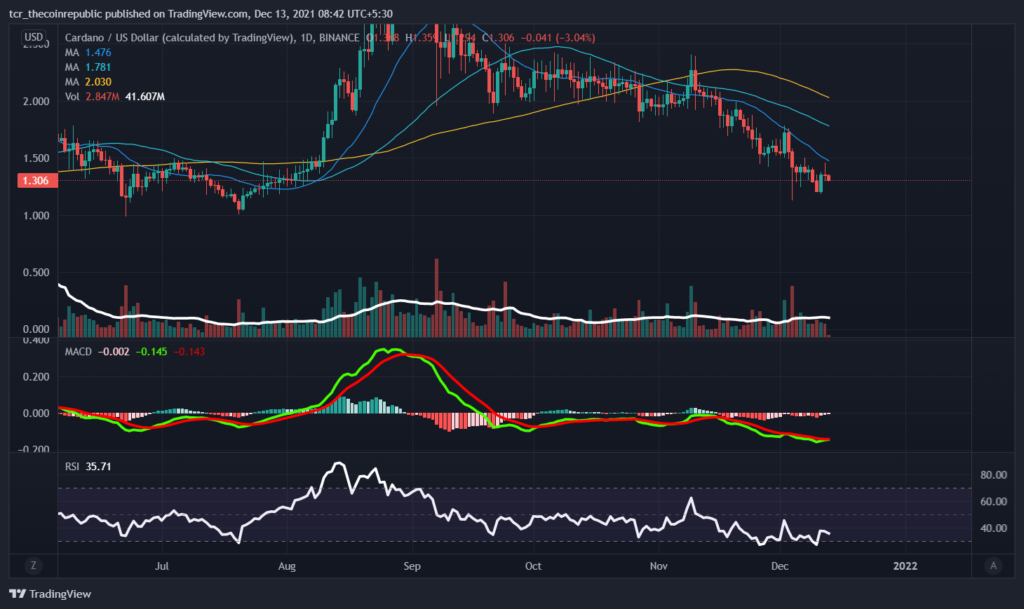
Long term view:-
In the daily chart time analysis, the price is near a demand zone as the bears are trying their best to break the support but are failing as the bulls are not letting the bears break it, so let’s have a look at the technical analysis to see if the price will break the support or will head towards the resistance?
Firstly, the MACD shows red histograms as the MACD line is below the signal line, but the MACD line is heading towards the signal line and will cross the signal line soon. That will be a buy signal for the traders if the cross is complete.
In addition to that, the RSI is in the neutral zone near 35, and the RSI line is pointing sideways, which means the bulls and bears are giving each other a good fight in the order book. Lastly, the 20MA is below the 50MA, and both are below the 100MA, showing a bearish sign.
 Tradingview
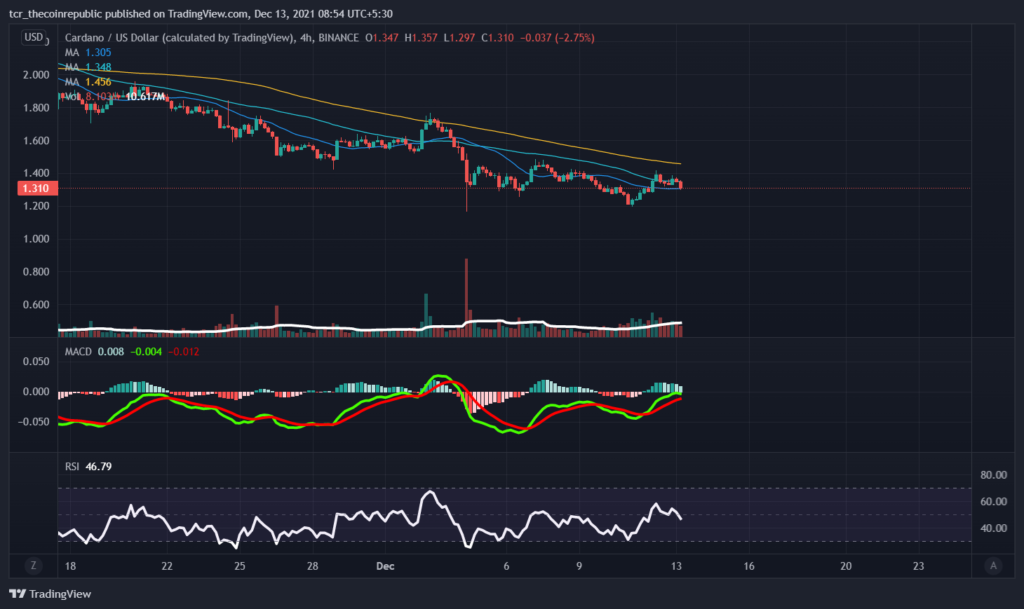
Short term view:-
In the 4-hour time interval, the 50MA is acting as a resistance, the bears are pushing the price down, not letting the bulls take it up, the MACD is showing the green histogram as the MACD line is above the signal line, but the MACD line is heading towards the signal line so that the cross will be a sell signal for the traders.
RelatedPosts


In addition to that, the RSI is in the neutral zone near 46, and the RSI line is pointing towards the oversold zone of 30, which means the bears are winning the fight against bulls in the order book. Lastly, the Moving average shows a bearish move, as the 20MA is below the 50MA, and both are below the 100MA.
 Tradingview
Conclusion:-
Looking at the long term and short term, the price is near the support the MACD is the 4 hours is showing a bearish move as the MACD line is heading towards the signal line if the cross is complete, it will change the trend to bearish, the RSI is showing a bearish sign as it pointing towards the oversold zone. Still, it’s different in the daily chart showing a bullish but the won’t complete as the 4-hour chart analysis will show on the daily soon.
RESISTANCE:-$1.772,$2.026
SUPPORT:- $1.178,$0.994
DISCLAIMER
The views and opinions stated by the author, or any people named in this article, are for informational ideas only, and they do not establish financial, investment, or other advice. Investing in or trading crypto assets comes with a risk of financial loss.
SNEKbot by DexHunter on CARDANO
Cardano's Telegram Trading Bot live on Cardano mainnet!TRADE NOW!