Cardano Price Analysis: ADA/USD Revisits the Previous Support at $1.25
Cardano Price Analysis – July 29 As it stands now, the ADA market is volatile, with prices recovering from $1.25 to trade at $1.27. ADA/USD Market Key Levels: Resistance levels: $1.45, $1.50, $1.55 Support levels: $1.10, $1.05, $1.00 ADA/USD...
Cardano Price Analysis – July 29
As it stands now, the ADA market is volatile, with prices recovering from $1.25 to trade at $1.27.
ADA/USD Market
Key Levels:
Resistance levels: $1.45, $1.50, $1.55
Support levels: $1.10, $1.05, $1.00
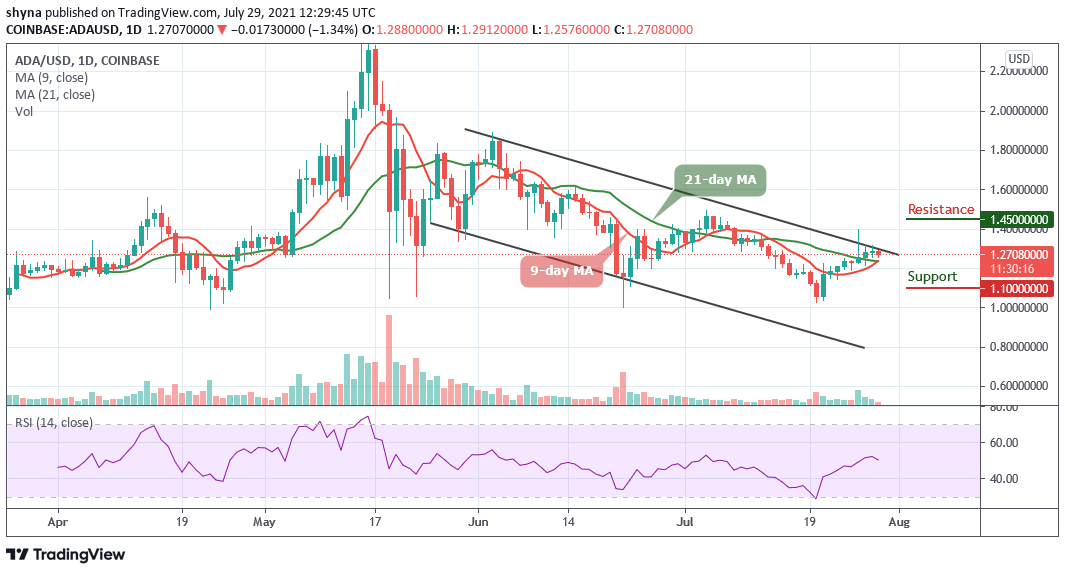
ADA/USD is currently trading at $1.27 as the bears delay the coin from crossing above the upper boundary of the channel. A few days ago, the Cardano price encountered higher resistance at $1.40 and fell down. Cardano (ADA) is down by 1.34% of its value and the downside momentum may be gaining traction. Therefore, the coin can break below the 9-day and 21-day moving averages to test the $0.15 level.
Cardano Price Analysis: ADA Price May Push Higher
At the time of writing, ADA/USD is changing hands at $1.27 as the coin keeps trading above the 9-day and 21-day moving averages with a 1.34% loss since the start of the day, though it is still following a sideways movement on a day-to-day basis, the Relative Strength Index (14) faces the south. On the intraday chart, ADA/USD may move below the moving averages with the next support at $1.15.
However, a sustainable move below this area could worsen the short-term technical picture and allow for an extended decline towards $1.10, $1.05, and a psychological $1.00 supports. On the upside, a return above $1.40 may help to mitigate the immediate bearish pressure. The price could return inside the previous consolidation range and get a chance to cross above the moving averages at $1.45, $1.50, and $1.55 resistance levels.
ADA/BTC Market: Bears are Flexing their Muscles
Against BTC, the direction of the market is following a downward trend. Although the price is still unstable; trading at a price level of 3208 SAT. A low swing could reach the 2800 SAT support level and below, creating a new low for this month. For now, the bears are gaining ground while they are declining; now slowly in action as the Relative Strength Index (14) is moving within the oversold region.
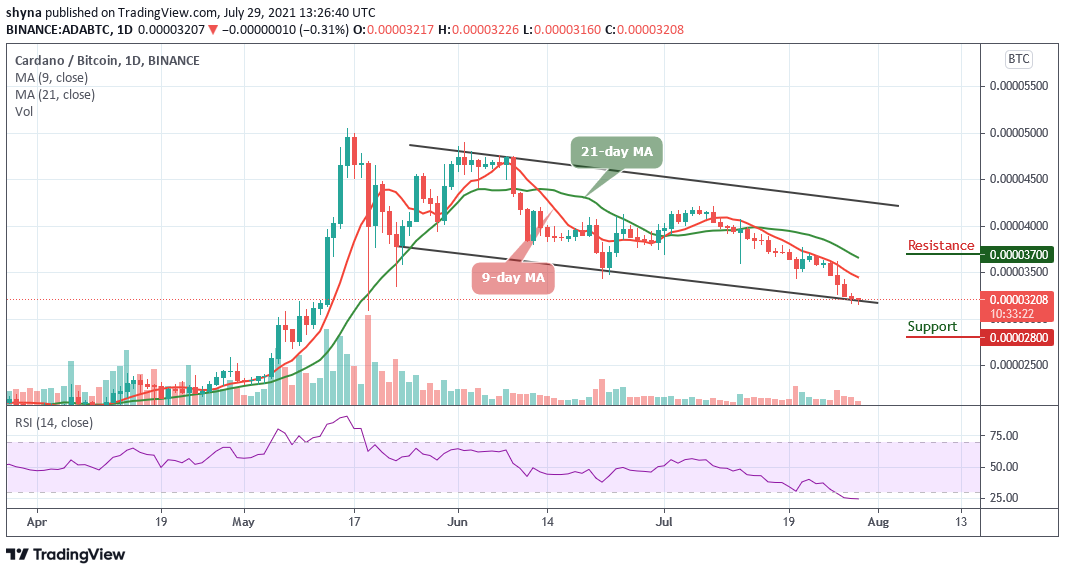 ADABTC – Daily Chart
In other words, a rebound is likely to occur if the signal line moves out of the oversold region and the coin cross above the 9-day and 21-day moving averages to reach the potential resistance at 3700 SAT and above.
SNEKbot by DexHunter on CARDANO
Cardano's Telegram Trading Bot live on Cardano mainnet!TRADE NOW!