Cardano Price Analysis: ADA/USD Remains in the Bearish Zone
Cardano Price Analysis – December 21 The Cardano (ADA) is slightly bullish with 1.71% gain since the opening of today’s trading. The nearest resistance could be at $1.30 level. ADA/USD Market Key Levels: Resistance levels: $1.50, $1.60, $1.70 Support...
Cardano Price Analysis – December 21
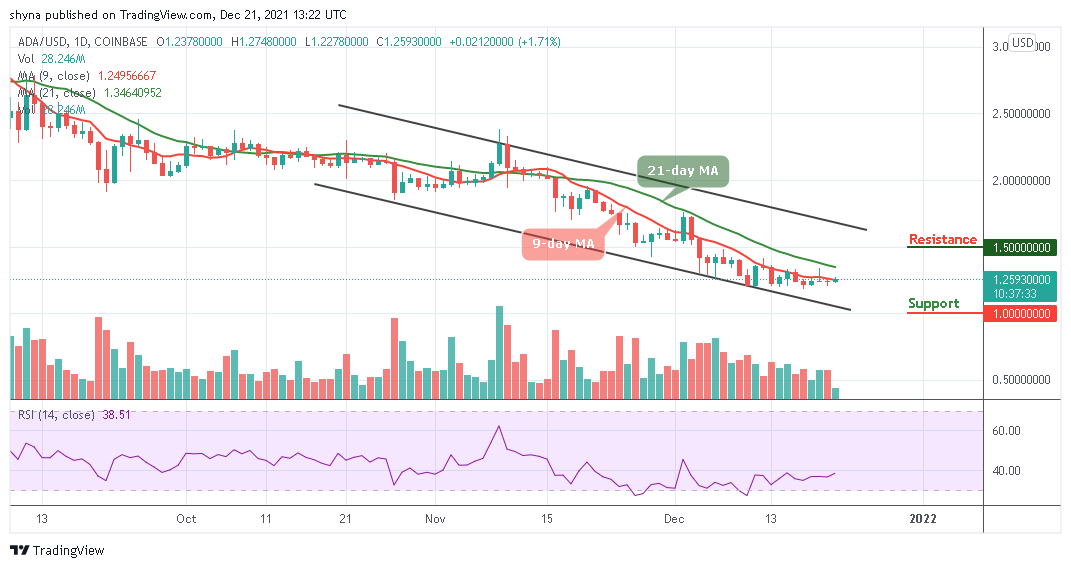
The Cardano (ADA) is slightly bullish with 1.71% gain since the opening of today’s trading. The nearest resistance could be at $1.30 level.
ADA/USD Market
Key Levels:
Resistance levels: $1.50, $1.60, $1.70
Support levels: $1.00, $0.90, $0.80
ADAUSD – Daily ChartAt the time of writing, ADA/USD is ranging at $1.25, which is now subjected to the price actions below the 9-day and 21-day moving averages over the past few days of trading. If the bears continue to take charge, the coin is may be losing momentum to the lower side of the channel along with a potential price surge. Meanwhile, the technical indicator Relative Strength Index (14) on the daily chart is still bearish and may continue to issue sell signals.
Cardano Price Analysis: ADA Price May Continue to Consolidate
Looking at the daily chart, the Cardano price is moving sideways below the 9-day and 21-day moving averages. Therefore, if the coin decides to stay under the control of bears, the price may likely drop below the lower boundary of the channel which could hit the nearest supports at $1.00, $0.90, and $0.80 respectively. On the upside, for the market to create an uptrend, the bulls need to push the market price above the 9-day and 21-day moving averages before locating the potential resistance levels at $1.50, $1.60, and $1.70.
ADA/BTC Market: Cardano Price Remains at the Downside
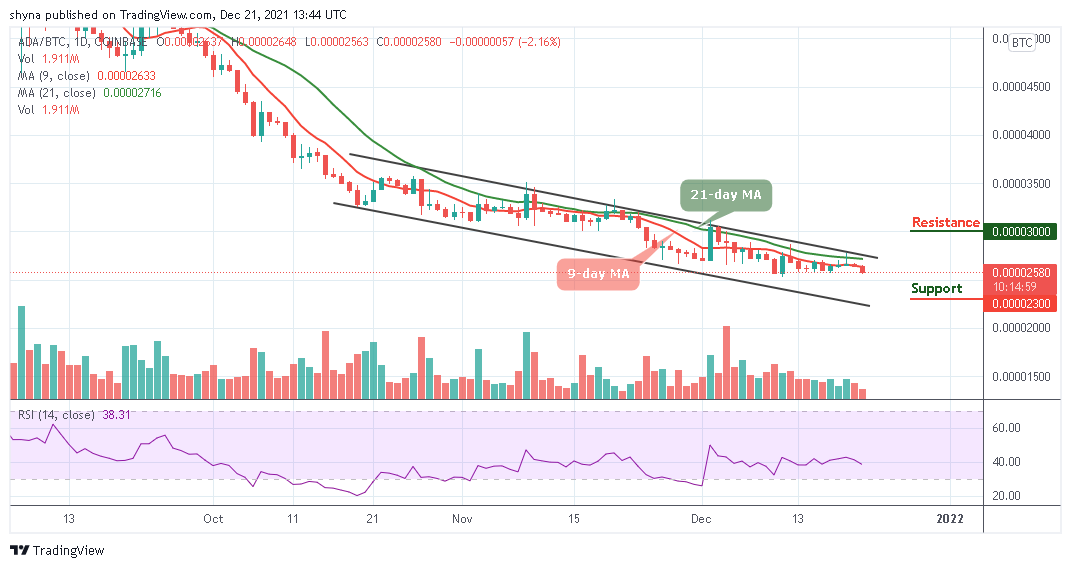
Against Bitcoin, the market is seen to be moving below the 9-day and 21-day moving averages and within the descending channel where the price is expected to break towards the lower boundary of the channel. Should the price cross below the channel, the market could experience more downtrends that may hit the key support level of 2300 SAT and below.
 ADABTC – Daily Chart
In other words, if the bulls could manage and push the market above the 9-day and 21-day moving averages, Cardano price may reach the resistance level of 3000 SAT and above. More so, the technical indicator Relative Strength Index (14) confirms that the market is been controlled by the sellers as the signal line crosses below 40-level.
SNEKbot by DexHunter on CARDANO
Cardano's Telegram Trading Bot live on Cardano mainnet!TRADE NOW!