Cardano Price Analysis: ADA/USD Range-bounds; Price Drops Below $2.09
Cardano Price Analysis – November 15 According to the daily chart, the Cardano price remains within the moving averages as the coin may trade below $2.00 level. ADA/USD Market Key Levels: Resistance levels: $2.30, $2.40, $2.50 Support levels: $1.80,...
Cardano Price Analysis – November 15
According to the daily chart, the Cardano price remains within the moving averages as the coin may trade below $2.00 level.
ADA/USD Market
Key Levels:
Resistance levels: $2.30, $2.40, $2.50
Support levels: $1.80, $1.70, $1.60
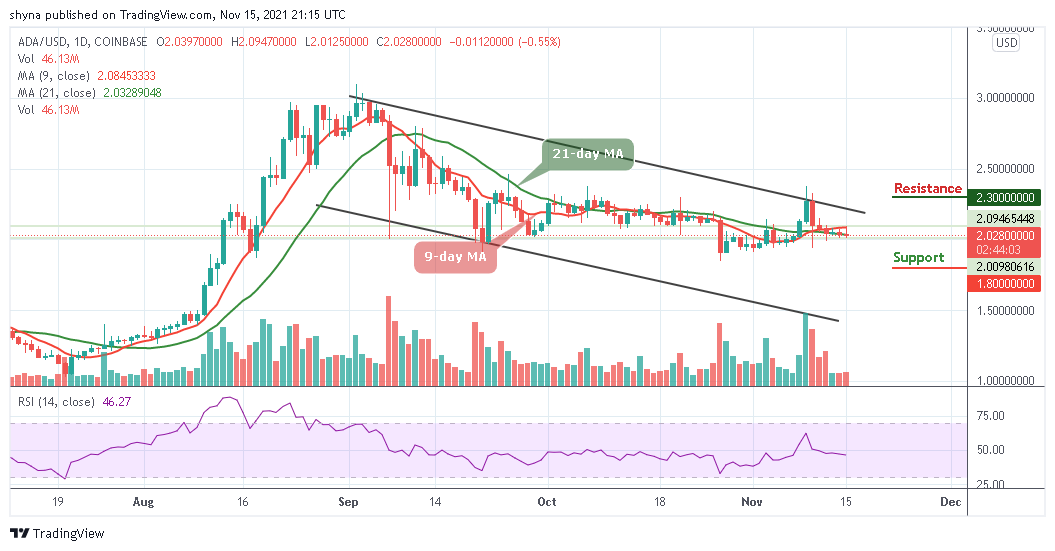
ADAUSD – Daily ChartADA/USD is currently falling below the 9-day moving average after touching the daily high of $2.09, which is now subject to the price actions around the 21day moving average. However, as the bears step back into the market, the Cardano price is seen losing momentum below the moving averages along with a potential price surge.
Cardano Price Analysis: ADA/USD May Follow the Downtrend
According to the daily chart, the Cardano price is moving sideways as the coin stays within the 9-day and 21-day moving averages. Meanwhile, a bullish cross above the 9-day moving average is needed to correct the immediate bearish pressure and bring the coin back on the recovery trend. Once it is out of the way, the upside is likely to gain traction with the next focus on $2.30, $2.40, and $2.50 resistance levels.
However, on the downside, once the support of $2.00 is broken, the sell-off may likely gain traction with the next focus at the nearest support level of $1.90, which could be followed by the nearest support level of $1.85. Therefore, if these levels are broken, the downside pressure may increase and the next support is created by the critical support of $1.80, $1.70, and $1.60 level as the technical indicator Relative Strength Index (14) moves below 40-level.
ADA/BTC Market: Cardano Price Remains At the Downside
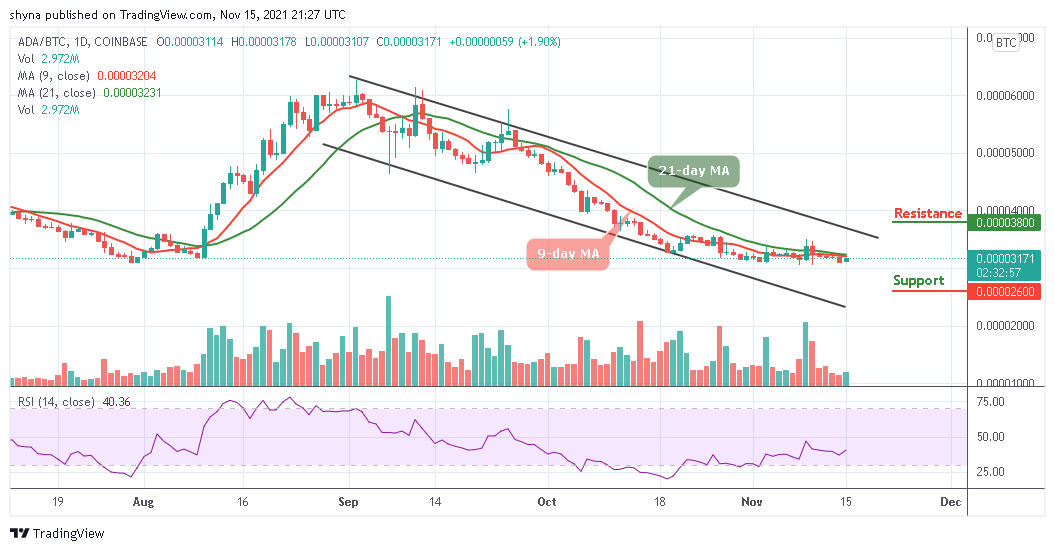
Comparing with BTC, the Cardano (ADA) is following a downward trend as reveals by the technical indicator Relative Strength Index (14). Although the market price is unstable as it hovers around 3171 SAT. Meanwhile, a low swing could push the coin to the support level of 2600 SAT and below. At the moment, the bears are gaining ground while they are declining as the Relative Strength Index (14) may stay below 40-level.
 ADABTC – Daily Chart
On the other hand, a rebound may occur if the buyers could defend the current level at 3171 SAT and push it above the 9-day and 21-day moving averages which could help the coin to hit the potential resistance level of 3800 SAT and above.
SNEKbot by DexHunter on CARDANO
Cardano's Telegram Trading Bot live on Cardano mainnet!TRADE NOW!