Cardano Price Analysis: ADA/USD Declines Below $2.5 Level
Cardano Price Analysis – August 21 At the time of writing, the Cardano (ADA) is volatile, with prices fluctuating below the upper boundary of the channel. ADA/USD Market Key Levels: Resistance levels: $2.9, $3.0, $3.1 Support levels: $2.1, $2.0,...
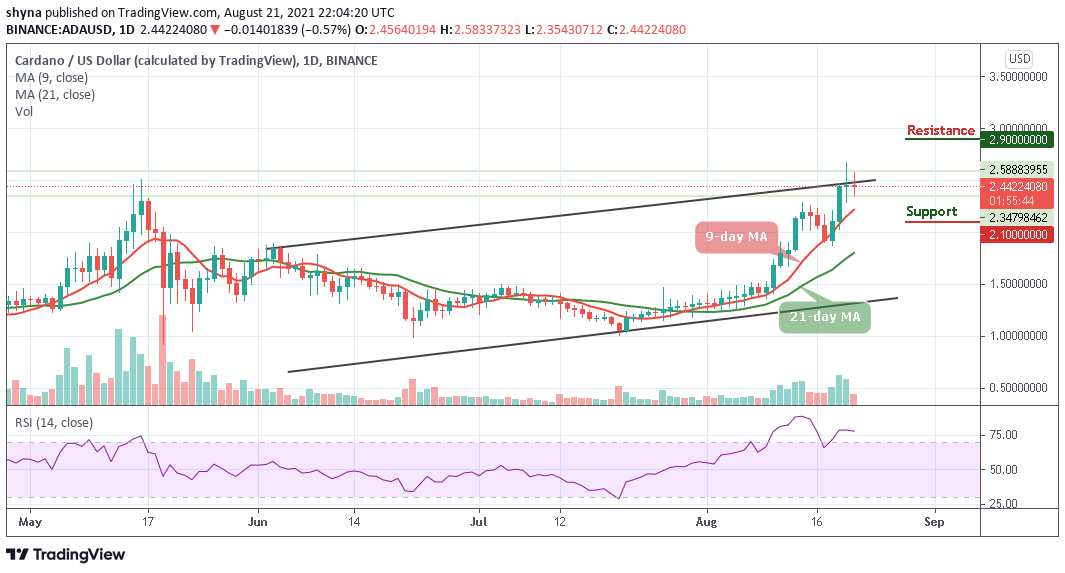
Cardano Price Analysis – August 21
At the time of writing, the Cardano (ADA) is volatile, with prices fluctuating below the upper boundary of the channel.
ADA/USD Market
Key Levels:
Resistance levels: $2.9, $3.0, $3.1
Support levels: $2.1, $2.0, $1.9
For the past two days, the slight drop has been positioning ADA/USD in a decline mode. As the daily chart reveals, the Cardano price is following the sideways movement above the 9-day and 21-day moving averages. Meanwhile, the coin has touched the previous support at $2.3 while a potential pullback may likely take the price up to retest the $2.5 resistance level above the upper boundary of the channel.
Cardano Price Analysis: Cardano Price May Keep the Uptrend
As the daily chart reveals, if the Cardano price decides to stay under the control of bears, the price may likely drop below the 9-day moving average and face the nearest support levels at $2.1, $2.0, and $19. On the upside, the bulls need to push the price above the upper boundary of the channel and this could reach the resistance levels at $2.9, $3.0, and $3.1.
Meanwhile, the technical indicator which is the Relative Strength Index (14) is seen moving within the overbought region to keep the uptrend. Therefore, if the coin stays at the upside, the bulls may continue to introduce more bullish signals into the market.
ADA/BTC Market: Cardano Price Stays At the Upside
When compares with Bitcoin, the coin has been unstable since it touches the monthly high of 5417 SAT. Presently, the Cardano price has recently managed to break above the upper boundary of the channel to reach the upside. Therefore, any effort by the buyers to keep the price at the upside may likely push the price to the resistance level of 5700 SAT and above.
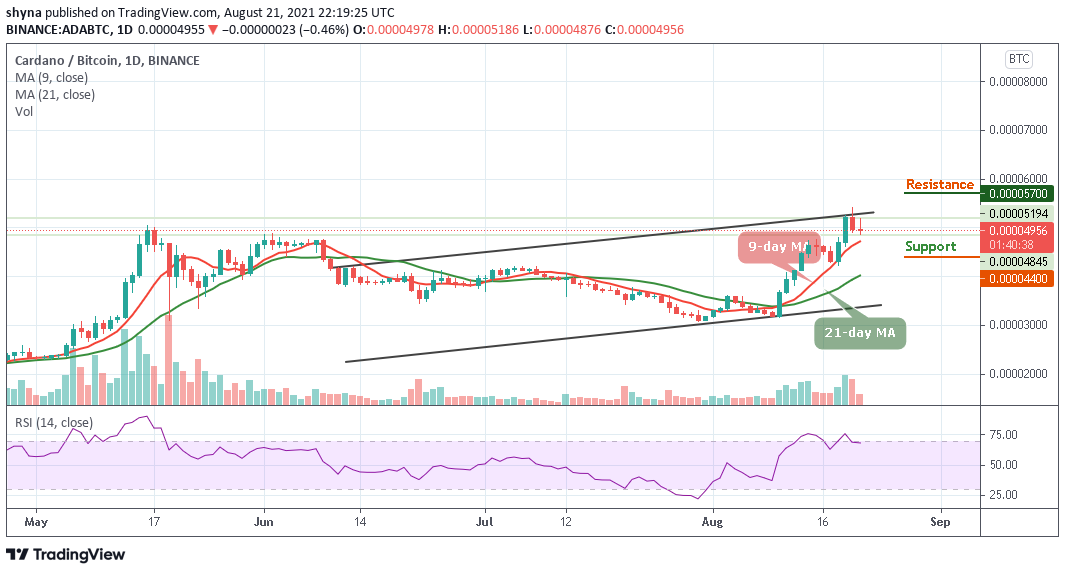
However, if ADA/BTC crosses below the 9-day moving average, the market is expected to reach the support levels of 4400 SAT and below. Meanwhile, the technical indicator Relative Strength Index (14) confirms that the market may remain at the upside as the signal line moves around 70-level.
SNEKbot by DexHunter on CARDANO
Cardano's Telegram Trading Bot live on Cardano mainnet!TRADE NOW!