Cardano Price Analysis: ADA/USD Declines Below $1.17 Level
Cardano Price Analysis – February 5 At the time of writing, the Cardano (ADA) is ranging, with prices fluctuating below the 9-day moving average. ADA/USD Market Key Levels: Resistance levels: $1.40, $1.50, $1.60 Support levels: $0.85, $0.75, $0.65 At...
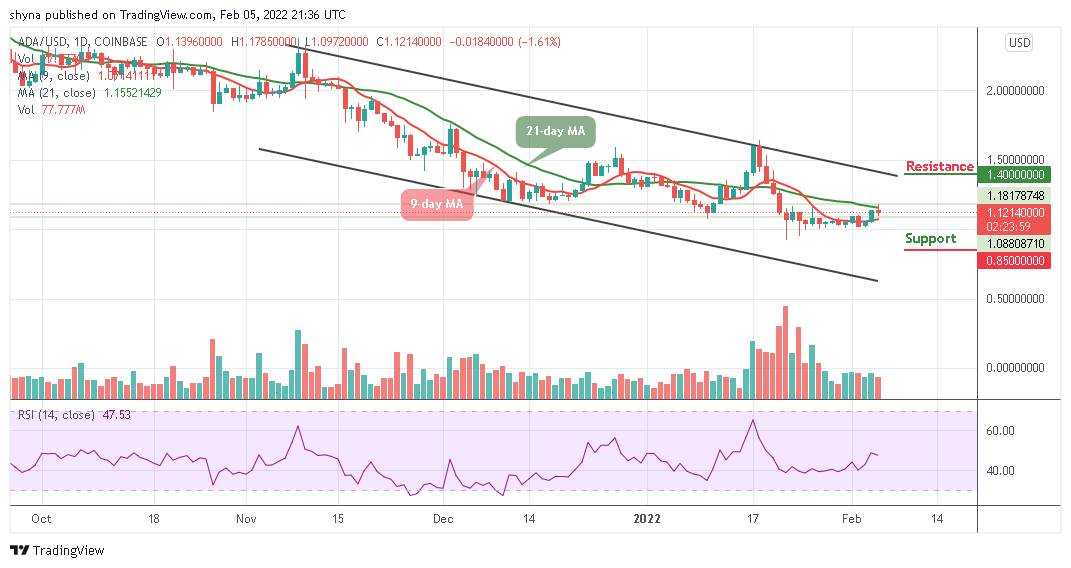
Cardano Price Analysis – February 5
At the time of writing, the Cardano (ADA) is ranging, with prices fluctuating below the 9-day moving average.
ADA/USD Market
Key Levels:
Resistance levels: $1.40, $1.50, $1.60
Support levels: $0.85, $0.75, $0.65
At the time of writing, ADA/USD is in a decline mode as the price is following the sideways movement within the 9-day and 21-day moving averages. Meanwhile, the coin touches the previous support at $1.09 while a potential pullback may likely take the price up to retest the $1.17 resistance level above the moving averages.
Cardano Price Analysis: Cardano Price May Begin the Uptrend
As the daily chart reveals, if the Cardano price decline below the 9-day moving average, the price may likely drop towards the lower boundary of the channel to face the support levels at $0.85, $0.75, and $0.65. On the upside, the bulls need to push the price above the upper boundary of the channel, and this could reach the resistance levels at $1.40, $1.50, and $1.60.
Meanwhile, the technical indicator, the Relative Strength Index (14) is seen moving below 50-level. Therefore, if the coin stays above the 21-day moving average, the bulls may introduce more bullish signals into the market.
ADA/BTC Market: Cardano Price May Remain Sideways
When compares with Bitcoin, the coin has been moving sideways below 9-day and 21-day moving average. Now, the Cardano price prepares to cross below the lower boundary of the channel to reach the downside. Therefore, any effort by the sellers to keep the price at the downside may likely bring the price to the support level of 2300 SAT and above.
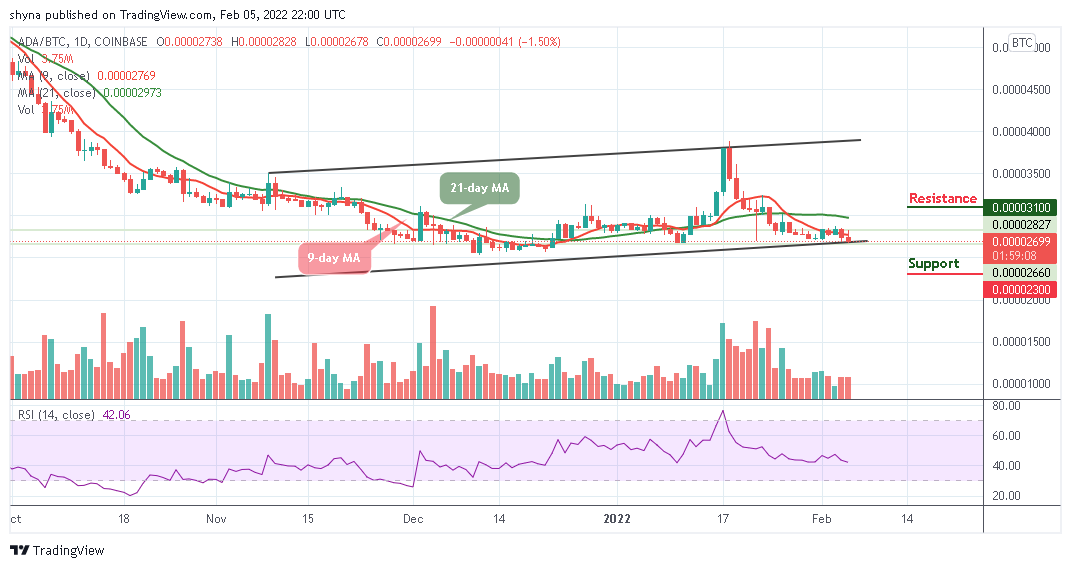
However, if ADA/BTC crosses above the 9-day and 21-day moving averages, the market is expected to reach the resistance level of 3100 SAT and below. Meanwhile, the technical indicator Relative Strength Index (14) confirms that the market may face the downside as the signal line moves to cross below 40-level.
SNEKbot by DexHunter on CARDANO
Cardano's Telegram Trading Bot live on Cardano mainnet!TRADE NOW!